ROAS Is Lying to You — What eCommerce Performance Marketing Actually Measures
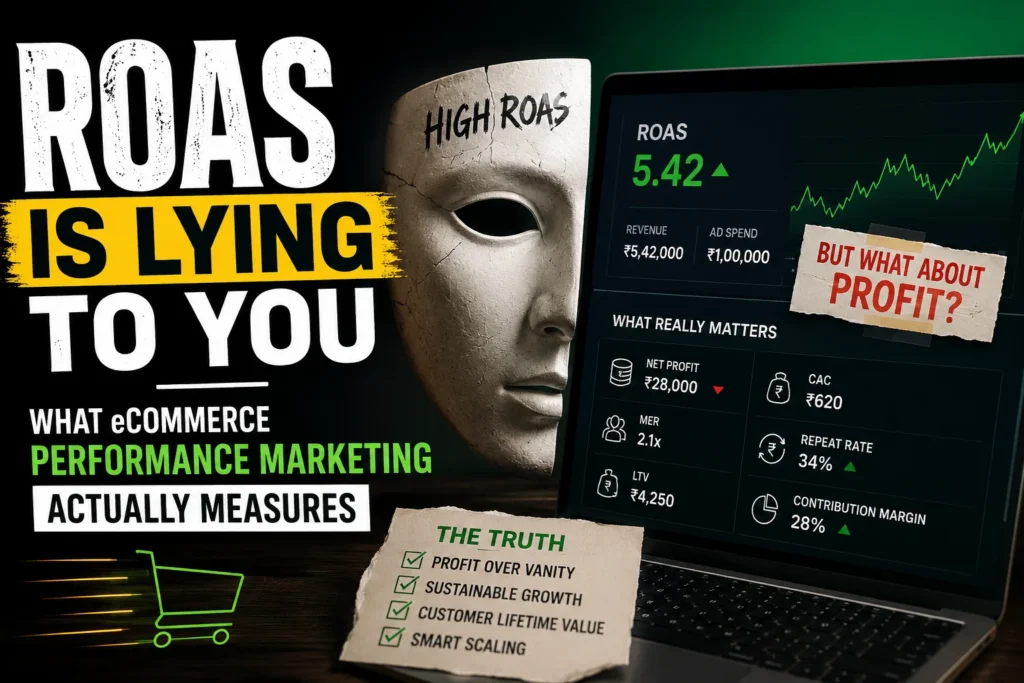
ROAS Is Lying to You What eCommerce Performance Marketing Actually Measures The Most Dangerous Number in Your Dashboard Every D2C founder knows the feeling. Your agency sends a screenshot — “4X ROAS this week!” — and for a moment, everything feels under control. Then you check your bank account. And the numbers don’t add up. This is the ROAS trap. And it’s quietly draining the profitability of thousands of eCommerce brands across India. A genuine eCommerce performance marketing agency measures what actually matters. Here’s what that looks like. What ROAS Doesn’t Tell You Let’s say your ads generate ₹4 in revenue for every ₹1 spent. 4X ROAS. Looks great. But now factor in: Product cost: 40% of revenue Shipping: ₹80 per order Returns: 15% of orders Agency fee: ₹30,000/month Platform fees (Shopify, payment gateway): 3% Suddenly that 4X ROAS is a breakeven proposition — or worse, a loss. ROAS is a top-line metric. It’s useful as one data point but catastrophic as a north star. Yet most agencies optimise for it because it’s easy to inflate and even easier to screenshot. Get Free Growth plan The Metrics That Actually Drive Profitable Growth A results-oriented eCommerce performance marketing agency tracks these instead: Cost Per Order (CPO) How much does it cost to generate one order — across all ad spend? This is the metric that maps directly to your P&L. Contribution Margin Per Order Revenue minus cost of goods, shipping, returns, and ad spend. This is your real profit per order. If it’s negative, scale kills you faster. Payback Period How many days does it take to recover the cost of acquiring a customer? For healthy D2C brands, this is 30–60 days. If it’s longer, cash flow becomes a growth blocker. Customer Lifetime Value (LTV) How much does a customer spend across all orders over time? Brands with strong LTV can afford a higher CPO because they know the customer will return. New Customer CAC vs Returning Customer Revenue Are you acquiring new buyers, or just retargeting the same audience repeatedly? A healthy brand grows its new customer base while maximising revenue from existing buyers. Get Free Growth plan How a Performance Funnel Actually Works Stage 1 — Creative The ad creative determines whether someone stops scrolling. The hook (first 2–3 seconds of video, or headline of a static) is everything. A weak creative wastes every rupee behind it. Stage 2 — Landing Page Where does the click go? A well-optimised product page with clear benefits, strong social proof, fast load speed, and a frictionless CTA converts. A generic Shopify default template doesn’t. Stage 3 — Offer Is the offer compelling? Bundles, free shipping thresholds, limited-time discounts, and gift-with-purchase offers all increase conversion rate and AOV simultaneously. Stage 4 — Checkout Every extra step in checkout loses buyers. A streamlined, mobile-optimised checkout — with COD, UPI, and card options prominent — is non-negotiable in the Indian market. Stage 5 — Post-Purchase The sale isn’t the finish line. Upsell offers, review requests, referral incentives, and reorder reminders all happen post-purchase — and they determine your LTV. Get Free Growth plan Why Creative Testing Separates Winners From Budget Burners The single biggest variable in Meta ad performance is creative quality. Not audience targeting. Not bid strategy. Creative. Best-in-class execution looks like this: Weekly test map: 3–5 new creatives tested per week Structured variables: hook vs hook, format vs format, angle vs angle Clear kill rules: if a creative doesn’t hit CPO threshold within 3 days, pause it Winner scaling: proven creatives get budget increases in controlled increments Evergreen rotation: winning creatives are refreshed before fatigue sets in At Aim n Launch, UGC is scripted, cast, and edited in-house — so the creative pipeline never runs dry and testing never stops. Get Free Growth plan What to Expect From an eCommerce Performance Marketing Agency Week 1–2: Account audit, pixel health check, creative audit, CPO and margin baseline set Week 3–4: New campaign structure built, first creative batch launched, tracking verified Month 2: Testing in full swing, weekly creative rotations, CPO optimisation underway Month 3: Winning angles scaled, retargeting layered in, WhatsApp and email integrated Month 4+: Compound growth — every winning creative, audience, and offer is refined and scaled You should receive daily performance updates — not weekly reports filled with screenshots — and real conversations about what’s working, what’s being paused, and why. Get Free Growth plan Conclusion: Stop Celebrating ROAS. Start Tracking Profit. If your current agency sends you ROAS reports and you’re still wondering why profit isn’t growing, the answer is in the measurement framework — not the ad spend level. The brands that scale profitably are the ones that track the right numbers, fix conversion leaks before scaling spend, and work with a partner that understands eCommerce unit economics at a fundamental level. Ready to switch from vanity metrics to real growth? Work With Aim n Launch — India’s eCommerce Performance Marketing Agency
The Complete eCommerce Digital Marketing Playbook for D2C Brands in India (2025)
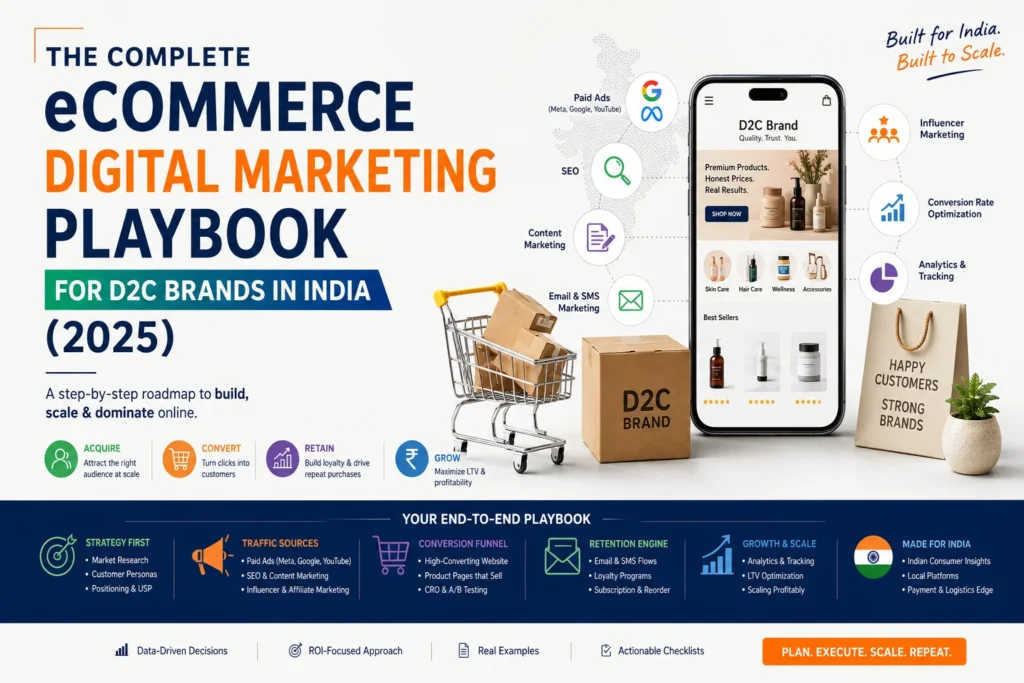
The Complete eCommerce Digital Marketing Playbook for D2C Brands in India (2025) Introduction: Selling Online Is No Longer Enough A decade ago, listing your product on a website was enough to generate sales. Today, the D2C space in India is one of the most competitive arenas in the world. Thousands of brands compete for the same buyer’s attention across Instagram, Google, WhatsApp, email, and beyond. The brands that win aren’t the ones with the best product alone. They’re the ones with the most cohesive, full-funnel eCommerce digital marketing system — one where every channel works together to acquire, convert, and retain customers profitably. This is the playbook that India’s top D2C brands follow. And it’s exactly what a specialist eCommerce digital marketing services partner should be building for your brand. Get Free Growth plan The 5 Pillars of eCommerce Digital Marketing 1. Paid Advertising (Meta & Google) This is the fastest way to generate traffic and orders — but also the easiest place to burn budget without a system. Meta Ads (Facebook + Instagram) excel at discovery and cold audience acquisition. Google Ads capture high-intent buyers who are already searching for your product. Most scaling brands run both, but the sequencing and budget split depend on your stage of growth. 2. Search Engine Optimisation (SEO) Organic traffic is your highest-margin acquisition channel. A well-executed SEO strategy — covering technical health, product and category page optimisation, and content marketing — builds a compounding traffic asset that keeps delivering even when ad spend is paused. 3. Email Marketing Email remains the highest-ROI channel in eCommerce, delivering an average return of ₹36 for every ₹1 spent. Welcome sequences, abandoned cart flows, post-purchase upsells, and win-back campaigns — each touchpoint is an opportunity to increase revenue without paying for another click. 4. WhatsApp Marketing In India, WhatsApp is where buyers live. Automated WhatsApp flows for cart abandonment, order updates, reorder reminders, and exclusive offers drive engagement rates that email can’t match. Brands using WhatsApp as a retention channel consistently outperform those that don’t. 5. Conversion Rate Optimisation (CRO) Traffic without conversion is wasted spend. CRO covers everything that happens after the click — product page design, offer clarity, checkout speed, trust signals, and bundle structures. Improving your conversion rate from 1.5% to 2.5% is the equivalent of getting 67% more revenue from the same ad budget. Get Free Growth plan Meta Ads vs Google Ads: What Works at Each Growth Stage Early Stage (₹0–₹5L/month ad spend): Start with Meta. It’s better for building awareness, testing creatives, and finding your winning audience cheaply. Google Shopping can run in parallel at a small budget to capture branded and category searches. Scaling Stage (₹5L–₹25L/month): Both channels run simultaneously. Meta drives new customer acquisition; Google retargets warm audiences and captures bottom-of-funnel searches. Performance Max campaigns begin here. Established Stage (₹25L+/month): Full-funnel operation. Meta handles prospecting with UGC and video creatives. Google runs Shopping, Search, and YouTube. Email and WhatsApp manage retention. SEO contributes 20–40% of total traffic organically. Get Free Growth plan The Role of Creative in Performance No channel works without strong creative. For Meta, the creative IS the targeting — the right video or image finds the right audience. For Google, it’s your product feed quality and ad copy that determines click-through rate. A professional eCommerce digital marketing services team doesn’t just run ads. It builds a creative testing system — weekly test maps across hooks, formats, and angles — retiring losers fast and scaling winners with budget. UGC (User Generated Content) scripted and edited in-house consistently outperforms polished brand videos at the cold audience stage because it feels real, native, and trustworthy. What Full-Funnel eCommerce Digital Marketing Actually Looks Like Here’s what a properly structured digital marketing system looks like for a D2C brand doing ₹50L–₹1Cr/month: Awareness: Meta video ads + Instagram Reels + Google Display Consideration: Retargeting ads + SEO blog content + YouTube Conversion: Optimised product pages + Google Shopping + WhatsApp nudges Retention: Email flows + WhatsApp broadcasts + loyalty offers Advocacy: UGC collection + review campaigns + referral programmes Each layer feeds the next. Awareness fills the top; retention maximises the bottom. Without all five working together, you’re leaving significant revenue on the table. Red Flags When Hiring an eCommerce Digital Marketing Agency Not all agencies are built for eCommerce. Watch out for these warning signs: They report ROAS but never mention Cost Per Order or payback period They have no creative production capability — they just run your existing assets They don’t track post-purchase behaviour or LTV They push you to increase budget before fixing your conversion rate They have no experience with D2C unit economics or Indian market nuances A specialist eCommerce digital marketing services partner will align every campaign decision with your margins, not vanity metrics. Get Free Growth plan Conclusion: Build a System, Not Just Campaigns The D2C brands that scale to ₹10Cr and beyond don’t just run ads. They build systems — where paid, organic, email, WhatsApp, and CRO all work together as a single revenue engine. That’s the difference between a brand that grows and a brand that survives. Want to build that system for your brand? Explore Aim n Launch’s eCommerce Digital Marketing Services
Why Your D2C Brand Is Invisible on Google (And How eCommerce SEO Can Fix It)
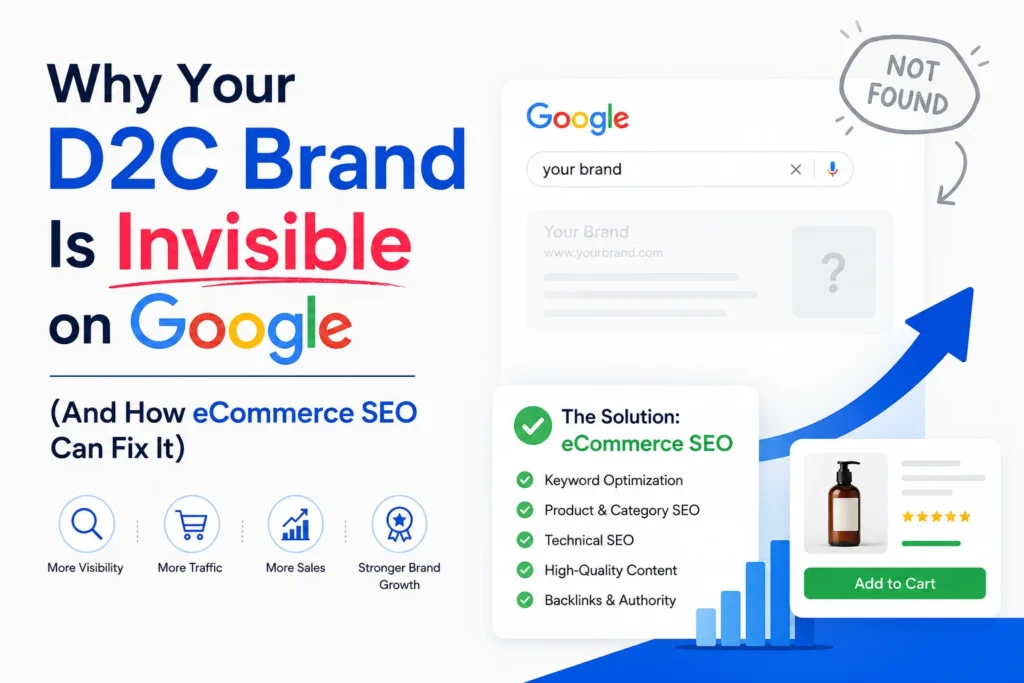
Why Your D2C Brand Is Invisible on Google (And How eCommerce SEO Can Fix It) Introduction: You’re Spending on Ads, But Where’s the Organic Growth? You’ve got a great product. Your Meta ads are running. Orders trickle in — but the moment you pause the campaign, sales drop to zero. Sound familiar? This is the reality for most D2C brands in India today. They’re entirely dependent on paid traffic, and every rupee of revenue comes with an ad cost attached. There’s no compounding. No organic engine. No brand visibility on Google. The fix isn’t more ads. The fix is eCommerce SEO. If your store doesn’t appear when someone searches for your product category, you’re handing those customers to your competitors — for free. Across all of them, the same patterns kept repeating — the same five or six mistakes that cap a brand’s growth, and the same five or six fixes that consistently break the ceiling. This isn’t a highlight reel. It’s what we’ve actually learned from sitting inside dozens of Shopify stores, ad accounts, and P&Ls. Lesson One: Demand Is Rarely the Bottleneck. Capture Is. Let’s talk numbers. If your average Customer Acquisition Cost (CAC) via Meta Ads is ₹400–₹800, and your Average Order Value (AOV) is ₹1,200 — your margins are already razor thin before accounting for shipping, returns, and operational costs. Now imagine ranking on Page 1 of Google for “buy [your product] online India.” That traffic costs you nothing per click. Every order that comes through organic search is a direct improvement to your unit economics. Brands that invest early in SEO build an asset. Those that don’t keep renting traffic — forever. The problem is that most D2C founders don’t know where to start, or they’ve been told “SEO takes too long.” That’s a half-truth. SEO does take time — but with the right eCommerce SEO service, you start seeing meaningful results within 3–6 months, and the returns compound for years. Get Free Growth plan What eCommerce SEO Actually Covers Many brands think SEO means writing a few blog posts. It’s far more structural than that. A proper eCommerce SEO service covers five core areas: 1. Technical SEO This is the foundation. It includes site speed optimisation, mobile usability, crawlability, fixing broken links, canonical tags, structured data (schema markup), and XML sitemaps. If Google can’t crawl and index your pages efficiently, nothing else matters. 2. On-Page SEO Every product page, collection page, and blog post needs to be optimised — title tags, meta descriptions, H1/H2 structure, keyword placement, internal linking, and image alt text. This is where most eCommerce stores are weakest. 3. Category & Collection Page Optimisation These pages carry enormous ranking potential and are almost always neglected. A well-optimised category page with strong content, FAQs, and proper keyword targeting can outrank individual product pages for high-volume terms. 4. Content Marketing & Blogging Informational content captures buyers at the top of the funnel — people who are researching before they purchase. A blog answering “best [product] for [use case]” ranks, builds trust, and drives warm traffic to your product pages. 5. Link Building Google still uses backlinks as a major ranking signal. Earning links from relevant, authoritative websites tells Google your brand is credible. This is a long-game play — but critical for competitive niches. Get Free Growth plan How Product Page SEO Directly Impacts Revenue Your product page is your digital salesperson. If it’s not ranking, it’s not selling. Here’s what a revenue-optimised product page looks like from an SEO perspective: Primary keyword in the title tag and H1 — not just your brand name Unique product description — not copied from the manufacturer (duplicate content kills rankings) Schema markup — so Google shows your price, ratings, and availability in search results Image alt text — descriptive, keyword-rich, and accessible Internal links to related products and category pages FAQs section targeting long-tail queries that your customers are actually searching Most D2C stores on Shopify or WooCommerce launch with default templates and zero SEO configuration. That’s traffic left on the table from Day 1. Get Free Growth plan The Most Underrated SEO Asset in eCommerce If you sell skincare, “face serums” is a category. If you sell fitness gear, “resistance bands” is a category. These pages should be your highest-ranking, highest-converting pages — and for most brands, they’re completely blank. A category page optimised by a specialist eCommerce SEO service will include: A keyword-rich H1 and introductory paragraph Subcategory links for internal structure Curated product listings with SEO-friendly URLs A bottom-of-page content block targeting secondary keywords FAQ schema to win featured snippets Done right, a single optimised category page can drive hundreds of qualified visitors every month — at zero cost per click. Get Free Growth plan Why D2C Brands Need a Specialist, Not a Generalist General SEO agencies know how to rank service pages and B2B websites. eCommerce SEO is a different discipline entirely. It involves: Managing thousands of product URLs at scale Handling duplicate content across variants (size, colour, SKU) Optimising for Google Shopping and organic simultaneously Building content funnels that move buyers from awareness to purchase Understanding D2C unit economics so SEO efforts align with margin goals This is why working with a dedicated eCommerce SEO service provider — one that understands the D2C model — makes a measurable difference versus hiring a generic agency or a freelancer who handles every industry. At Aim n Launch, SEO isn’t an add-on. It’s built into the growth system alongside performance marketing, CRO, and creative — so every channel reinforces the other. What to Expect in the First 90 Days of eCommerce SEO Month 1 — Audit & Foundation Technical audit, keyword mapping, competitor gap analysis, fixing critical on-page and technical issues, setting up Google Search Console and Analytics properly.
₹55 Crore+ Revenue Generated: Lessons from Scaling 50+ D2C Brands in India
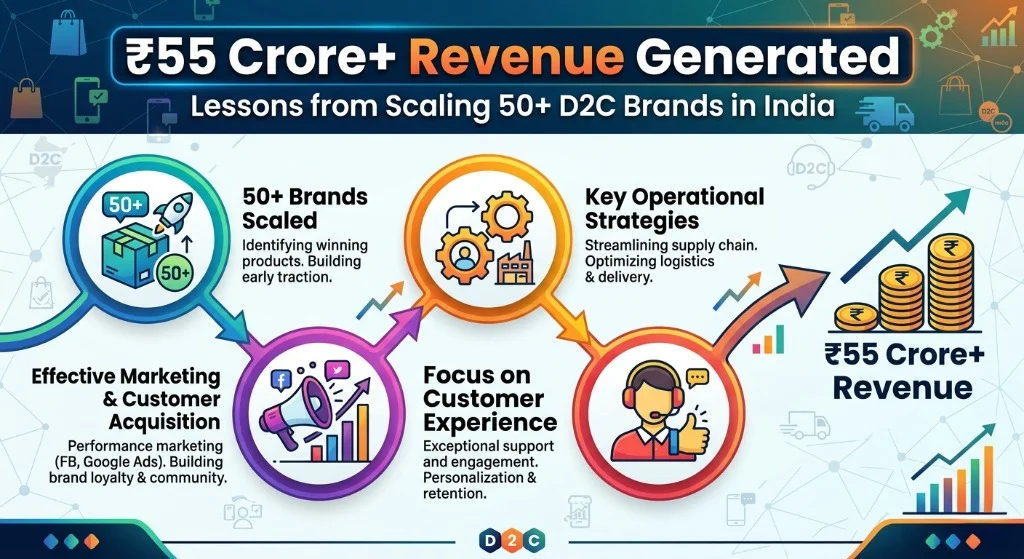
₹55 Crore+ Revenue Generated: Lessons from Scaling 50+ D2C Brands in India We’ve now worked with over 50 D2C brands across India — protein and nutrition, fashion, FMCG snacks and beverages, jewellery, wellness, home and beauty — and helped generate more than ₹55 crore in client revenue along the way, with an average return on ad spend of 4.2x. Some of these brands had appeared on Shark Tank India. Others were quietly profitable businesses nobody outside their category had heard of. A few were burning cash on ads with no idea why. Across all of them, the same patterns kept repeating — the same five or six mistakes that cap a brand’s growth, and the same five or six fixes that consistently break the ceiling. This isn’t a highlight reel. It’s what we’ve actually learned from sitting inside dozens of Shopify stores, ad accounts, and P&Ls. Lesson One: Demand Is Rarely the Bottleneck. Capture Is. We’ve lost count of how many founders come to us convinced their problem is “not enough demand,” when the real issue is that their existing demand is being captured inefficiently. One Shark Tank-featured protein snacks brand was stuck at ₹7–8L a month despite genuine product-market fit and national visibility from the show. The bottleneck wasn’t traffic. It was that ad spend was scattered across a dozen SKUs, none of which ever generated enough conversion data for Meta’s algorithm to optimize properly. Once we consolidated spend behind a single hero bundle, that same brand hit ₹30.2L the following month — a 289% jump with no increase in underlying demand, just a fix to how that demand was being routed. This is the single most common pattern across our client base: brands assume they have a top-of-funnel problem when they actually have an offer-architecture problem. Get Free Growth plan Lesson Two: Bundles Outperform Discounts Almost Every Time Founders default to discounting because it’s the fastest lever to pull. It’s also usually the most expensive one, because most discounts are applied reactively — 10% off this week, a flat ₹100 off the next — with no math behind what the margin can actually absorb. The brands that scale profitably treat bundling as the primary AOV lever, not discounting. In one fashion brand engagement, two-piece bundle sets lifted AOV by 9% and ended up contributing 28% of all Meta-driven revenue. In the protein snacks case mentioned above, a “3+1” bundle alone generated 65% of total gross sales in its breakout month. Bundles increase perceived value, give the ad algorithm a stronger purchase-value signal to optimize toward, and protect margin in a way that blanket discounting structurally can’t. Lesson Three: Most Brands Are One Channel Away From Disaster We see this constantly — a brand growing nicely on the back of one channel, whether that’s Meta, SEO, or a single hero SKU, with no real diversification underneath. It works fine until that one channel softens. In one fashion brand case, organic search was contributing over 25% of total tracked revenue, which is genuinely impressive — but it also meant a single algorithm update or backlink decay event could take a quarter of the business’s revenue overnight. The fix isn’t to abandon what’s working. It’s to build a second and third channel in parallel — email, WhatsApp, SEO content — so growth isn’t single-threaded. Get Free Growth plan Lesson Four: Returning Customer Rate Is the Most Underpriced Metric in D2C Across consumable categories especially — protein powders, snacks, beverages, wellness products — we routinely see returning customer rates sitting below 5%, sometimes as low as 3%. For products that people physically run out of every three to four weeks, that’s not a minor leak. It means the brand is rebuilding its entire customer base from scratch every single month, paying full acquisition cost every time, with zero compounding. The fix is almost always simpler than founders expect: a post-purchase tagging system, timed reorder nudges aligned to the product’s actual consumption window, and a loyalty hook that doesn’t require a full subscription infrastructure to start. In one engagement, this alone moved returning customer rate from 3.3% to 5.13% in a single month — a 53% improvement before the retention system was even fully built out. Get Free Growth plan Lesson Five: Contribution Margin Math Has to Happen Before You Scale, Not After This is the one that separates profitable scaling from cash-burning growth, and it’s the mistake we see most often among brands that have already raised funding or built some momentum. They scale ad spend based on top-line ROAS without ever calculating CM2 — contribution margin after product cost, shipping, payment gateway fees, discounts, and ad spend per order. We run this calculation before recommending any scale-up, every single time. In one case, this discipline let us responsibly push discounts up 505% month-over-month, because the math showed the bundle’s margin could absorb it — and net sales grew 263% as a direct result, with AOV rising rather than falling. Without that math done first, the same discount increase could just as easily have destroyed the brand’s margin while looking like a win on the surface. Get Free Growth plan Lesson Six: Prepaid Mix Is a Margin Lever Most Brands Ignore Cash-on-delivery feels like it removes friction at checkout, but it quietly drains margin through higher return-to-origin rates, slower cash realization, and weaker repeat behavior. We’ve seen brands shift from roughly 60% prepaid to near-total prepaid simply by making one-click checkout the default experience and layering in small prepaid-specific incentives — a move that alone can swing margin per order by three to five percent. It’s not glamorous work, but it’s pure margin recovered without spending another rupee on ads. Get Free Growth plan What 50+ Brands Have Taught Us About “Scaling” If there’s one thread connecting every brand we’ve grown past its ceiling, it’s this: scaling is never really about spending more. It’s about fixing the system underneath the spend — the offer, the catalog architecture, the discount logic, the
How an Indian Fashion Brand Achieved 4.98X ROAS with Performance Marketing
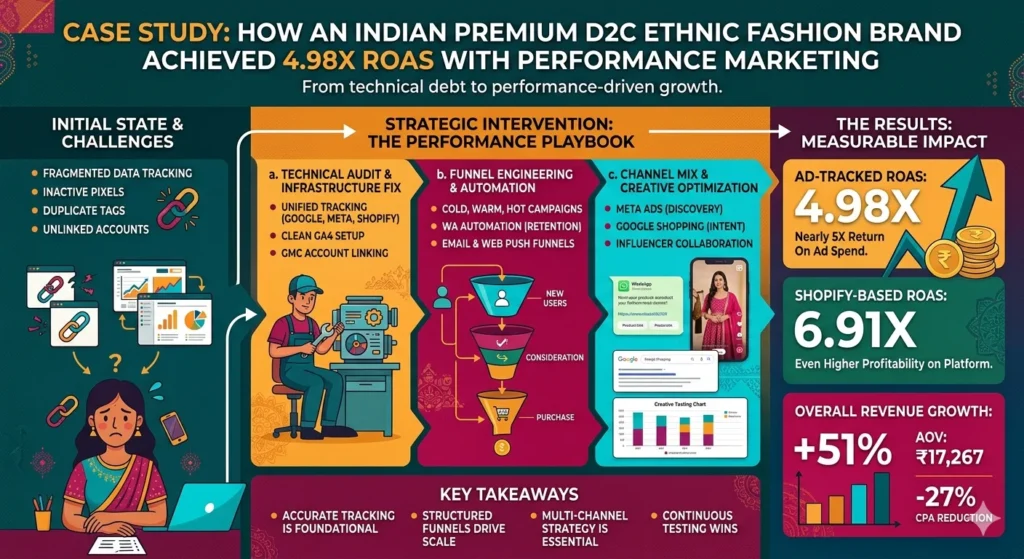
How an Indian Fashion Brand Achieved 4.98X ROAS with Performance Marketing Fashion is one of the hardest categories to scale profitably online. It’s a high-consideration purchase, margins get eaten by discounting pressure, and most brands hit a ceiling where paid traffic converts fine at small spend but falls apart the moment you try to scale it. That was exactly where this home and fashion brand stood when we started working with them in August 2025.Paid traffic was converting. It just wasn’t scaling. Organic revenue was sitting untapped. And there was no real system protecting average order value as discounting pressure crept up month over month. Over a single 31-day period, we took the brand to ₹42,33,340 in tracked revenue, anchored by a 4.98x ROAS on Meta and a 6.69x blended marketing efficiency ratio. Here’s the system behind that number. Setting a Real Target, Not a Vanity One Before touching a single campaign, we set three concrete targets: break ₹30 lakh in monthly tracked revenue, keep Meta cost-per-acquisition at or below ₹300, and build an SEO revenue moat that would reduce the brand’s dependence on paid spend over time. Notice that none of these targets were “increase ROAS.” ROAS is an output. CPA discipline and channel diversification are the inputs that actually produce it. Get Free Growth plan The Paid Media System On Meta, we moved away from product-only creative and leaned into static lifestyle and room-transformation visuals — content that showed the product in context rather than just on a white background. A “before/after” static format outperformed product-only angles by 18% on click-through rate, and once we saw that, we rolled it into the weekly creative rotation rather than treating it as a one-off win. We also tested Advantage+ Catalog campaigns with broad targeting against the brand’s existing stacked interest segments. Broad targeting won, lifting ROAS by 12%. This runs counter to what a lot of advertisers assume — that narrower targeting performs better — but at this stage of Meta’s algorithm, broad targeting paired with strong creative consistently outperforms over-restricted audiences, because the algorithm gets more room to find genuine buyers instead of being boxed in by interest signals that may not even be accurate anymore. Fatigue automation rules ran in the background, auto-pausing underperformers so the team’s attention stayed on what was working. The result: no campaign saw a ROAS dip greater than 8% week-on-week across the entire period, which is what real stability looks like at scale. Get Free Growth plan Building the SEO Moat This is the piece most performance-only agencies skip entirely, and it’s the reason the brand’s growth had stalled. We built a category hub architecture with a proper internal linking framework, added PDP schema markup and SEO-optimized copy, and created topic clusters around “how to” search intent — things like arranging wall art or styling a small room — that intercept shoppers earlier in their decision process, before they’re even searching for the product by name. Category hubs with internal linking lifted SEO sessions by 31%, and 60% of all SEO revenue ended up coming through hub-driven journeys rather than direct landing page visits. The topic cluster pages converted at 4%, which is a strong number for content sitting in the middle of the funnel. By the end of the period, SEO was contributing ₹10.78L in revenue at near-zero incremental media cost — a real moat, not a vanity metric. Get Free Growth plan Protecting AOV Without Killing Margin Through Discounts High-consideration categories like fashion live or die on AOV defense. We introduced two-piece bundle sets specifically engineered to lift order value, and they delivered: a 9% AOV lift, with 28% of all Meta-driven revenue coming from bundled purchases. We also added size and fit guides, made the returns policy visible at the product page level, and rewrote checkout microcopy to clarify delivery timelines — small frictions that, removed together, cut cart abandonment by 6%. A cart-level upsell module suggesting matching accessories added another ₹2.1L in incremental revenue with an 11% attach rate — pure margin-positive revenue that required no additional ad spend to generate. The Numbers Metric Value Meta Spend ₹6,33,114 Purchases 2,331 Meta Revenue ₹31,55,340 ROAS 4.98x CPA ₹272 AOV ₹1,354 SEO Revenue ₹10,78,000 Total Tracked Revenue ₹42,33,340 Blended MER 6.69x CPA held at ₹272 against a target ceiling of ₹300, and Meta remained the primary growth engine at 75% of total tracked revenue, with SEO contributing the remaining 25% at a fraction of the cost. What We’re Watching Going Forward We don’t treat a strong month as a finished job, and we told this brand the same things we’re telling you now. A quarter of total revenue still depends on organic search, which means a backlink decay event or a Google algorithm update could hit hard — the next priority is building out an email and WhatsApp retention layer so the brand isn’t single-threaded on any one channel. The ₹1,354 AOV is solid but fragile, and the next lever is expanding bundle SKUs and introducing a premium tier. The creative pipeline behind the weekly rotation is thinner than we’d like, which means a structured UGC and influencer licensing program needs to come online before fatigue creeps back in. And at 4.1%, the add-to-cart-to-purchase rate is still low for fashion — there’s real room in testing one-click checkout, COD messaging, and EMI visibility directly at the cart. The Pattern Behind the Number A 4.98x ROAS doesn’t come from one good ad. It comes from CPA guardrails that were respected even while scaling, an SEO channel built in parallel so the brand isn’t entirely paid-dependent, AOV protected through bundling instead of blanket discounts, and a creative testing cadence that catches fatigue before it shows up in the numbers. Pull any one of those levers out and the ROAS number gets a lot harder to sustain past month one. Want this level of clarity and control over your own numbers? Book a 20-minute audit and we’ll walk through where your account stands
How We Scaled a Shark Tank India Brand from ₹7.8L to ₹30.2L in a Single Month
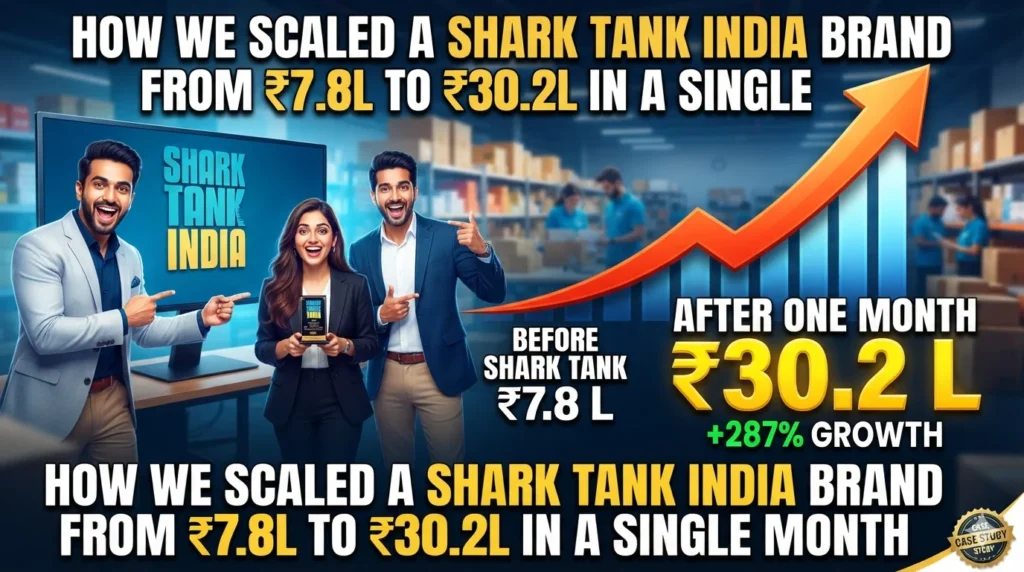
How We Scaled a Shark Tank India Brand from ₹7.8L to ₹30.2L in a Single Month Getting featured on Shark Tank India is a marketer’s dream. The visibility is instant, the credibility is built-in, and suddenly your brand name is a household reference. But here’s what nobody tells founders before the episode airs: the Shark Tank bump fades, and what’s left is whatever growth system you’ve built underneath it. We learned this firsthand while working with a Shark Tank-featured D2C brand in the healthy snacks and protein nutrition space. The brand sold protein powders, snack packs, and bundles through its own Shopify store. The product was good. Reviews were strong. National visibility had already happened. And yet, the brand was stuck doing ₹7–8 lakh a month — a number that had nothing to do with demand and everything to do with how that demand was being captured. In one month, we took it from ₹7.8L to ₹30.2L in gross sales. Net sales grew 263%, orders jumped from roughly 900 to over 3,000, and AOV actually went up by 6% even as we leaned harder into discounting. Here’s exactly how that happened — and why most Shark Tank brands leave this kind of growth on the table. The Real Problem Wasn’t Demand. It Was a Scattered Catalog. When we audited the account, the brand had a healthy spread of SKUs — multiple protein powder flavors, snack bundles, sampler packs. On paper, that variety looks like strength. In practice, it was quietly strangling the account. Ad spend was distributed almost evenly across a dozen products. No single SKU ever got enough budget or conversion volume to give Meta’s algorithm the signal density it needs to optimize. Spread ₹7–8L across ten-plus products and none of them exit the learning phase properly. The result was predictable: inconsistent ROAS, climbing CPAs, and campaigns that never stabilized long enough to scale. Underneath that, three more issues compounded the problem. The brand’s bundle option — a “3+1” pack — existed but was buried in the catalog instead of positioned as the default purchase. Discounts were applied reactively, sometimes 10% off, sometimes a flat ₹100, with no math behind what the unit economics could actually absorb. And the returning customer rate sat at just 3.3%, which for a consumable product meant the brand was rebuilding its customer base from zero every single month. None of this was a product problem or a market problem. It was a systems problem. Get Free Growth plan Strategy One: We Made One Bundle the Hero Offer The highest-margin, highest-AOV item in the catalog was the 3+1 bundle. It was getting the same ad budget as individual powder variants priced at a third of its value. We flipped that completely. Every part of the funnel — creative, copy, landing page hierarchy — was rebuilt to point to the bundle as the default purchase. Individual SKUs were repositioned as entry points and upsells, not primary conversion targets. We engineered the bundle pricing so the effective average selling price stayed above ₹750 even after discounts, and we ran full contribution margin (CM2) math — covering ad spend, discounts, shipping, and returns — before scaling a single rupee of budget. That single decision generated ₹19.7L from the bundle alone in the second month, a 448% jump, and it accounted for 65% of total gross sales by itself. When you consolidate signal behind one high-value offer, Meta’s algorithm finally gets what it needs: dense conversion data on a high-AOV event. CPAs drop. ROAS stabilizes. Scaling stops being a guessing game. Get Free Growth plan Strategy Two: We Stopped Spraying Budget Across Too Many Ad Sets Over-segmentation is one of the most common mistakes in Indian D2C Meta advertising, and this account had it badly — too many ad sets chasing too many products with too little budget behind each one. We rebuilt the structure into three clean layers. Top of funnel ran broad audiences with the bundle as the only offer, letting Meta’s algorithm find buyers rather than restricting it with narrow interest targeting. Mid-funnel retargeting shifted the message from “discover this product” to making the case for why the bundle was the smartest purchase, using social proof and value comparison. Bottom-funnel campaigns targeted cart abandoners with dynamic product ads and stacked offers — a discount plus free shipping — to close the loop. Budget followed a 60/25/15 split across top, middle, and bottom of funnel, intentionally weighted toward prospecting because the bundle’s margin could sustain a longer attribution window. Fewer campaigns meant more budget per campaign, which meant faster learning, which meant lower CPAs within the first week. By week two, campaigns were fully optimized and we started scaling aggressively. Get Free Growth plan Strategy Three: We Got Aggressive With Discounts — But Only After Doing the Math In the first month, discounts totaled roughly ₹1.01L against ₹7.8L in gross sales — about a 13% rate, applied with no real strategy. In the second month, we intentionally pushed discounts up to ₹6.15L, a 505% increase. That sounds reckless until you see what it was funding. Because the discount was baked directly into the bundle’s “buy 3, get 1 free” structure, it created a strong value proposition without breaking the underlying unit economics. AOV didn’t fall — it rose 6%, from ₹747 to ₹791, because the bundle structure forced multi-item carts. Customers weren’t buying cheaper. They were buying more. Net sales grew 263%, from ₹6.5L to ₹23.6L, meaning the ₹6.15L invested in discounts generated a 3.8x return on that spend alone, before even counting lifetime value. This is the difference between discounting reactively to hit a weekly number and engineering discounts as a calculated investment with a measurable return. Get Free Growth plan Strategy Four: We Fixed the Payment Mix Cash-on-delivery orders were quietly working against the brand — higher return-to-origin rates, delayed cash flow, weaker customer lifetime value. For a health-conscious, digitally comfortable audience, that gap was an obvious miss. We pushed a one-click checkout
What Most eCommerce Agencies Won’t Tell You (And Why It’s Costing You Money)

What Most eCommerce Agencies Won’t Tell You (And Why It’s Costing You Money) Most D2C founders have been burned by an agency before they ever talk to us. Not because the agency was incompetent, necessarily — most of them know how to run Meta and Google campaigns. The problem is what they don’t tell you while they’re running them. After auditing dozens of ad accounts handed over from other agencies, here’s what we keep finding, and what it’s actually costing founders. “ROAS” Isn’t the Number You Think It Is Most agencies report a screenshot of platform-reported ROAS and call it a win. But platform ROAS doesn’t account for discounts given, returns, payment gateway fees, or shipping cost. A campaign showing 4x ROAS on the Meta dashboard can be barely breakeven — or actively losing money — once you run the real contribution margin (CM2) math: product cost, shipping, gateway fees, discounts, and ad spend, all set against actual order value. This is the single biggest gap we see. Agencies optimize toward the metric that’s easiest to screenshot, not the metric that determines whether you’re actually making money. We don’t recommend scaling spend until we’ve run that CM2 waterfall and know the unit economics hold at the target cost per order — not after we’ve already pushed budget and hoped. Get Free Growth plan They’ll Keep Pushing Spend Even When the Page Is Leaking If your product page has a confusing layout, a slow checkout, or no trust signals at the point of purchase, more traffic doesn’t fix that — it just means more people are seeing the leak. We’ve inherited accounts where an agency had spent months scaling ad budgets on a product page converting at half the category benchmark, because nobody had ever looked past the ads dashboard. Fixing the actual leak — product page clarity, offer structure, checkout speed — is almost always cheaper and faster than trying to out-spend a conversion problem. Most agencies won’t tell you this because diagnosing it requires looking at your store, not just your ad account, and that’s not what they’re set up to do. “Weekly Reports” Often Mean Weekly Observations, Not Weekly Decisions A lot of agency relationships run on a Friday report that summarizes what already happened. That’s retrospective, not active management. By the time you’ve read last week’s numbers, the campaign has already been bleeding for seven days. The accounts that actually scale get daily attention — raising winners, pausing losers, swapping creative, iterating in near real time. The difference between weekly observation and daily intervention compounds fast, especially during a scaling phase when a campaign’s performance can shift meaningfully within 48 hours. Get Free Growth plan One-Off Creatives Without a Testing Map Ask most agencies for their creative testing plan and you’ll often get a vague answer about “trying a few things.” Without a structured map of angles crossed with formats — and a clear rule for when to retire a loser — creativity becomes guesswork dressed up as strategy. We’ve seen brands run the same three ad creatives for months because nobody had a system forcing fresh tests, and performance quietly decayed the entire time through fatigue nobody was tracking. A real testing cadence means new angle-and-format combinations going out every week, with clear performance thresholds for killing what isn’t working — not waiting for a noticeable crash before reacting. Blanket Discounts Instead of Engineered Offers This is one of the most expensive habits in Indian D2C marketing. An agency under pressure to hit a weekly revenue target will often just throw a discount at the problem — 10% off, then 15%, then a flat amount — with no model behind what the margin can absorb. It works short-term and quietly erodes the business long-term. The alternative is building AOV through bundles and pricing clarity rather than steepening discounts every time growth stalls. In real client work, two-piece bundles have lifted AOV by 9% while contributing over a quarter of total ad-driven revenue — value created without the margin damage that comes from discounting deeper every month. Get Free Growth plan No Real Ownership of Retention Most performance agencies are scoped purely around acquisition — get the ad live, get the click, get the purchase, move to the next customer. Email and WhatsApp flows, if they exist at all, often sit with a separate vendor nobody is actively managing. The result is a brand running a permanent new-customer acquisition machine, even in categories where the product gets consumed and reordered every few weeks. We’ve seen returning customer rates sitting at 3–4% across consumable D2C categories that should realistically be double or triple that. Recovering abandoned carts, prompting timely reorders, and nudging repeat purchases isn’t a side project — it’s often cheaper than anything available on the paid media side, because the customer has already been acquired once. Random Targeting Decisions Instead of Letting Creative Do the Work A lot of agencies still default to narrow interest-stacked targeting because it feels more “strategic.” In practice, broad targeting paired with strong creative regularly outperforms heavily restricted audiences on Meta’s current algorithm — in one fashion brand engagement, broad targeting with Advantage+ Catalog beat stacked interest segments by a 12% ROAS lift. The creative does the targeting work now. Audiences that are too narrow just starve the algorithm of the volume it needs to find real buyers efficiently. Get Free Growth plan Why This Pattern Repeats None of this is about agencies being dishonest. Most of it comes down to scope and incentive. An agency paid to run ads will optimize for ad metrics. An agency that isn’t looking at your Shopify store, your checkout flow, your payment mix, and your retention numbers simply can’t see the leaks sitting outside their lane — even if they wanted to. The brands we’ve helped scale past their ceiling — including a Shark Tank-featured brand that went from ₹7.8L to ₹30.2L in gross sales in a single month — got there because
The Real Reason D2C Brands Fail to Scale Past ₹10L/Month on Meta Ads
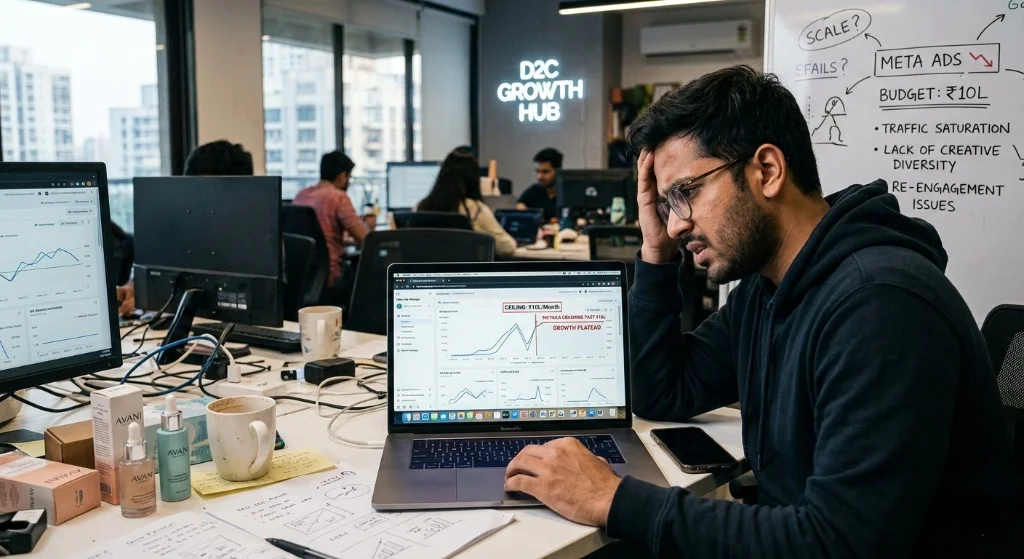
The Real Reason D2C Brands Fail to Scale Past ₹10L/Month on Meta Ads There’s a wall that almost every growing D2C brand hits on Meta. You’re spending ₹2–3 lakh a month. The ROAS is decent, maybe 3x or 4x. You feel ready to push. So you increase the budget. And then, predictably, everything gets worse. CPO climbs. ROAS tanks. The creatives that were working suddenly stop performing. You pull back, things stabilise, and you try again next month. Same result. This cycle is so common it has an unofficial name in performance marketing circles: the Meta spending ceiling. And breaking through it requires understanding something most agencies won’t tell you: the ceiling isn’t set by the algorithm, it’s set by the systems around your ads. Here’s a complete breakdown of what’s actually going wrong, and how the brands that successfully scale past ₹10L, ₹20L, and ₹50L/month on Meta are built differently. Myth: More Budget = More Sales (Why It Doesn’t Work That Way) When you double your Meta budget, you’re not simply buying twice as many of the same customers. You’re exhausting your existing warm audience faster and forcing the algorithm to reach progressively colder prospects. Colder audiences convert at lower rates. That’s not a Meta failure, it’s physics. The question is whether your broader system is built to handle the economics of reaching a colder audience at scale. Most brands aren’t. And when they push budget into colder audiences without fixing the underlying infrastructure, CPO explodes. The brands we see scaling successfully through our eCommerce performance marketing work have solved three problems that most don’t even know they have. Get Free Growth plan Problem 1: Creative Volume and Velocity is Too Low This is the number one scaling killer we see, and it’s the most fixable. At ₹2L/month of spend, you might get away with 3–4 creatives cycling. At ₹8L+, you need fresh creative almost every week. Audience saturation happens faster at higher budgets, the same 10 lakh people see your creative much faster when you’re spending 4x more. Without new creative going in, the algorithm has no fresh material to test. It keeps showing your existing ads to the same people, frequency climbs, CTR drops, CPO climbs, and the whole account looks like it’s “broken.” What successful scalers do: Launch 4–6 new creative variations every 7–10 days Test multiple angles: problem-aware hooks, transformation-led narratives, social proof-first UGC, direct-response product demos Have a clear creative retirement policy: if frequency is above 2.5 and CTR is falling, the creative is done regardless of nostalgia Track hook-rate (what percentage of people watch past 3 seconds) as the primary creative health metric, not just ROAS At Aim n Launch, we build and manage this creative engine in-house, scripting, casting, and editing UGC that feeds the Meta algorithm consistently. It’s why our eCommerce digital marketing service includes creative production, not just ad buying. Get Free Growth plan Problem 2: The Landing Page Can’t Handle Colder Traffic This is where the CRO problem we cover in our piece on Shopify stores with traffic but no sales (Blog 2 above) becomes a Meta scaling problem. Warm traffic, people who’ve seen your brand before, who follow you, who were retargeted, converts at 3–5% even on an average page. Cold prospecting traffic, people who’ve never heard of you, converts at 0.8–1.5% even with a great page. If your store converts at 1.2% overall, you’re probably converting cold traffic at 0.5–0.7%. At low budgets, that’s masked by your warm audience doing the heavy lifting. At higher budgets, the majority of your spend is hitting cold audiences, and your CPO becomes unviable. The fix isn’t “get better at targeting.” The fix is a better page. Specifically, a cold-traffic page needs to do significantly more work than a standard product page: It must establish brand credibility within the first scroll (awards, press, customer count, Shark Tank appearances, anything that signals legitimacy fast) It must answer the “why should I trust this brand I’ve never heard of” question before it asks for money It needs the social proof volume to be overwhelming, not 12 reviews, but 200+ reviews with photos, with responses, with specificity Without this infrastructure, no amount of Meta budget optimisation will fix your scaling ceiling. Problem 3: You’re Optimising for the Wrong Outcome This is the sneakiest problem, because it feels like you’re doing everything right. Many brands scaling on Meta are optimising their campaigns for Purchase conversions, which sounds correct. But if your pixel data is thin (under 50 purchase events per week per ad set), the algorithm doesn’t have enough signal to find the right buyers. It’s essentially guessing. The result: you get lots of add-to-carts that don’t convert, or you get purchases from people who return everything, or you get one-time buyers with zero LTV. Fixes that work in 2026’s Meta environment: Consolidate campaigns. More campaigns ≠ more data. Fewer, broader ad sets with consolidated budgets give the algorithm more signal to work with. Use Advantage+ Shopping Campaigns for proven products where you have enough purchase data. For newer products or thinner data, optimise for Add to Cart or Initiate Checkout to build signal faster, then transition to Purchase once the pixel has volume. Layer in a retention system (WhatsApp + email) so that the LTV of buyers you acquire justifies a higher CPO tolerance at scale. If your LTV is ₹2,000 but you’re capping CPO at ₹400, you’re leaving a lot of viable buyers on the table. Get Free Growth plan Problem 4: You Have No Offer Designed for Scale The offer that works at ₹2L/month of spend often doesn’t work at ₹10L/month, not because the offer is bad, but because you’ve saturated the segment of the market most receptive to it. As you reach broader, colder audiences on Meta, you need an entry offer that’s lower-friction. A ₹1,499 product with no trial, no guarantee, and no bundle is hard to sell to someone who’s never heard of your brand. A ₹799 starter
Why Your Shopify Store Gets Traffic But No Sales (CRO Fixes That Actually Work)
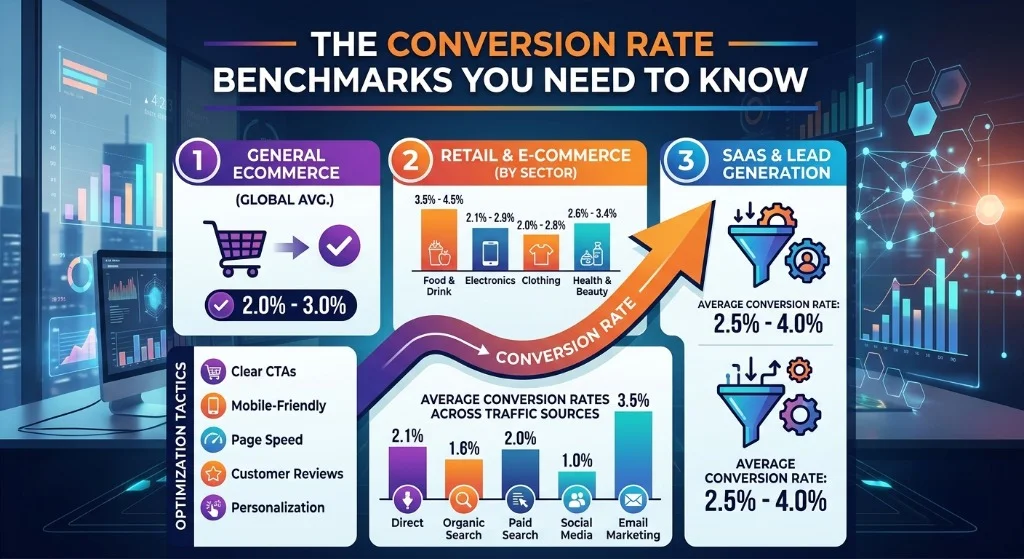
Why Your Shopify Store Gets Traffic But No Sales (CRO Fixes That Actually Work) You check the analytics and the traffic looks decent. The ad is getting clicks. People are landing on the page. And then… nothing. They leave. This is one of the most frustrating situations in eCommerce, and it’s far more common than most founders realise. A 1% conversion rate is not “normal”, it’s a signal that money is actively leaking out of your funnel with every visitor who bounces. The good news: conversion rate is one of the highest-leverage numbers in your entire business. Moving from 1% to 2% doesn’t just double your sales, it halves your effective customer acquisition cost, which means every rupee you spend on ads suddenly becomes twice as valuable. Here’s a systematic breakdown of why Shopify stores lose buyers, and the CRO fixes that actually move the needle. Get Free Growth plan First: The Conversion Rate Benchmarks You Need to Know Before diagnosing a problem, you need a baseline. For Indian D2C brands on Shopify: Under 1%: Serious structural issue. Traffic and offer are fundamentally misaligned, or the page itself is broken. 1–1.8%: Below average. Most standard Shopify stores with decent ads land here. There’s real opportunity. 1.8–2.5%: Solid. You’re competitive, but there’s still significant upside in offer and page optimisation. 2.5–4%+: Strong. At this level, scaling ad spend produces meaningfully profitable returns. Most brands we audit through our Shopify development services are sitting between 0.8% and 1.5%. That’s not a traffic problem, it’s a conversion problem. Get Free Growth plan The 7 Reasons Your Shopify Store Isn’t Converting 1. Your Page Load Time is Killing You Before Anyone Sees a Product In India, where a significant chunk of traffic comes from mobile on 4G connections, page speed is existential. A 3-second load time loses roughly 40% of visitors before the page even renders. Run your store through Google PageSpeed Insights right now. If you’re scoring below 50 on mobile, you are bleeding customers at the very top of the funnel before your headline, your images, or your offer ever get a chance. Common culprits: uncompressed images, too many third-party apps loading scripts, heavy theme files. These are fixable, often in a single focused development sprint. 2. Your Hero Section Doesn’t Answer the Three-Second Question The moment someone lands on your product page, they’re unconsciously asking: “Is this for me, and do I trust it?” You have roughly three seconds to answer both. Most Shopify product pages fail here because: The hero image shows the product but doesn’t show the transformation or use case The headline is the product name (“Mango Butter Face Cream”) rather than the outcome (“Hydrated skin in 7 days, or your money back”) Trust signals (reviews, badges, guarantees) are buried below the fold where most mobile users never scroll The fix is surgical: lead with the benefit, back it immediately with a single compelling trust signal, and make the “Add to Cart” button impossible to miss above the fold. 3. Your Offer Is Generic Offering a flat 10% discount is not a compelling offer. It’s a forgettable one. The D2C brands converting at 3%+ are building perceived value into the offer itself: A starter kit bundle priced attractively below the sum of individual products A free gift with first order (not a discount, a gift) A clear guarantee that removes purchase risk (“Full refund if your skin doesn’t improve in 30 days”) Offers aren’t just about price. They’re about reducing the perceived risk of clicking “Buy.” We explore this in depth in our broader post on breaking the D2C revenue plateau (Blog 1 above), particularly around AOV-lifting offer architecture. 4. You Have No Social Proof Above the Fold Indian consumers are deeply community-influenced buyers. Before purchasing from a brand they don’t know, they want evidence that real people bought this and didn’t regret it. If your reviews are at the bottom of the page, they might as well not exist for the majority of mobile visitors who never get there. Fixes that work: A review count and star rating directly under the product title 2–3 curated customer photo reviews visible in the first scroll A “As seen in” media bar if you have press coverage UGC video clips embedded directly on the product page (not just in an Instagram feed widget) 6. You’re Not Recovering Abandoned Carts On average, 78% of Indian eCommerce shoppers abandon their carts. That’s not a lost sale, that’s a warm lead who got distracted. A basic cart abandonment sequence via WhatsApp and email can recover 15–25% of these. Most Shopify stores have no recovery sequence at all, or send a single generic email hours later. A three-touch sequence, WhatsApp at 30 minutes, email at 2 hours, WhatsApp with a gentle nudge at 24 hours, dramatically outperforms the default. This is part of the retention infrastructure we build as part of our eCommerce digital marketing services. 7. Your Ad and Landing Page Are Misaligned This is the silent conversion killer that almost no one talks about. If your Meta ad shows a specific product, that ad must land on that product’s page, not your homepage, not your collections page, not a general landing page. Message match is critical. If your ad says “Try our new Vitamin C serum,” and the landing page leads with a generic brand headline about natural skincare, you’ve broken the psychological thread that the click was following. The visitor feels confused, even if they can’t articulate why, and they leave. Audit every active ad this week. Does the creative headline match the page headline? Does the ad’s offer match the page’s offer? If not, you’ve found your conversion leak. Get Free Growth plan The CRO Priority Stack: Where to Start If you’re overwhelmed by the list above, here’s the order of priority by impact-to-effort ratio: Fix first (highest impact, quickest to implement): Page speed (compress images, reduce apps) Hero section headline and CTA rewrite Add cart abandonment via WhatsApp
D2C Brand Hitting a Revenue Plateau? Here’s the Scaling Framework That Works in 2026
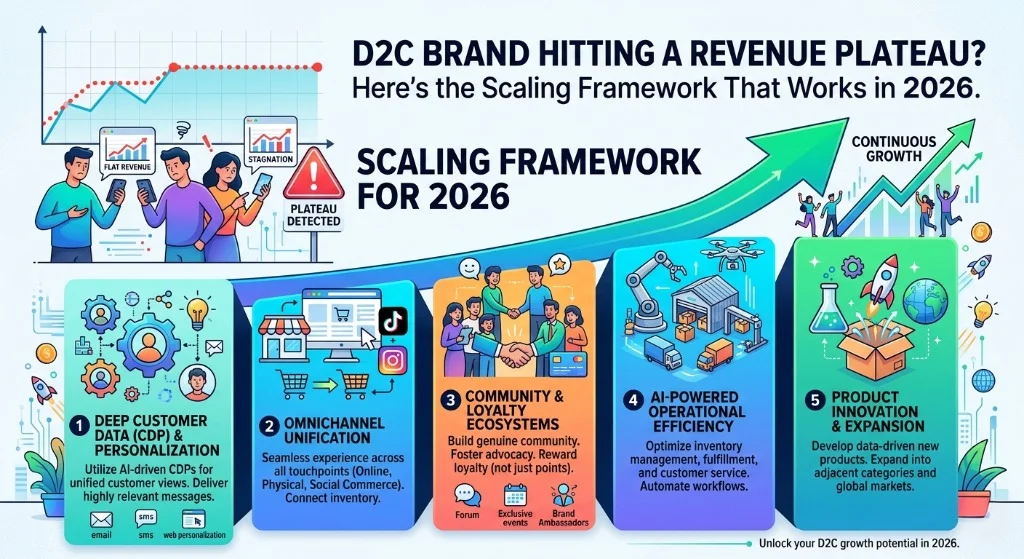
D2C Brand Hitting a Revenue Plateau? Here’s the Scaling Framework That Works in 2026 You hit ₹8 lakh in month three. Then ₹9 lakh. Then… ₹8.5 lakh again. The ads are running. The product reviews are good. The team is working hard. But the number on the dashboard just won’t move. This is the D2C plateau, and it’s one of the most demoralizing places a founder can find themselves. The cruel irony is that the tactics that got you here are exactly what’s keeping you stuck. In this post, we’ll break down why D2C brands plateau, what the actual scaling levers are in 2026, and the end-to-end framework that’s helped brands we work with at Aim n Launch move from flat months to consistent growth toward ₹50L, ₹1Cr, and beyond. Why Your Revenue Plateau Isn’t an Ads Problem The first thing most founders do when revenue stalls is blame the ads. ROAS drops slightly and suddenly there’s a full audit of creatives, targeting, budgets. Sometimes that’s relevant, but more often, the plateau has nothing to do with the top of the funnel. Here’s what’s actually happening across the three most common plateau stages: The ₹3–5L Plateau: Your product-market fit is real, but your unit economics are broken. You’re discounting too aggressively to drive first orders, CAC is creeping up, and you have zero retention infrastructure to make any of it profitable. The ₹8–12L Plateau: You’ve figured out acquisition on one or two creatives, but audience saturation is setting in. You have no creative refresh system, no second channel, and your landing page is still the generic Shopify template you launched on. The ₹20–30L Plateau: You’re profitable but you can’t scale spend without your Cost Per Order (CPO) blowing up. This is almost always a conversion problem, the offer, the page, or the checkout, not an ads problem. Understanding which plateau you’re actually in determines everything about your next move. Get Free Growth plan The 5-Lever Scaling Framework We’ve worked with 50+ D2C brands across fashion, beauty, food, and lifestyle through our eCommerce performance marketing services, and the brands that break through plateaus all do five things differently. Lever 1: Nail Your North Star Metric Stop optimising for ROAS. It is a vanity metric that tells you nothing about profitability. The brands that scale have one number at the centre of every decision: Cost Per Order (CPO) relative to their Average Order Value (AOV). Before you change a single ad, define: What CPO can your margins absorb? What is your current blended CPO across all channels? What would your CPO look like if AOV increased by 20%? Once you’re optimising for a profitable CPO rather than an impressive ROAS screenshot, decision-making becomes dramatically clearer. Lever 2: Fix Conversion Before Scaling Spend This is the one that most agencies skip because it requires actual work beyond the ads dashboard. If your store converts at 1.2% and you double your ad spend, you’ll get double the losses. A store that converts at 2.8% on the same spend generates 2.3x the revenue. Your product page, offer structure, checkout flow, and page speed are the real multiplier on your ad spend. We go deep on this in our post on why your Shopify store gets traffic but no sales, which is worth reading before you touch your budget. Lever 3: Build a Creative Engine, Not a Creative Stockpile The brands we see plateau hardest are the ones who made three great UGC videos six months ago and are still running them. In 2026, creative fatigue sets in within 2–3 weeks on Meta. A scaling brand runs a creative testing system: weekly launches of 3–5 new ad variations, clear tracking of hook performance in the first 3 seconds, and a ruthless policy of retiring anything that’s fatigued, even if it worked brilliantly last month. Our eCommerce digital marketing services include in-house UGC scripting, casting, and editing for exactly this reason. Lever 4: Multi-Channel, But in the Right Order Many brands try to launch Google, Meta, and influencer campaigns simultaneously and end up mediocre at all three. The right sequencing matters. Start with Meta, it’s the fastest feedback loop for Indian D2C brands with a visual product. Once you’ve validated your CPO target and have a creative system, layer in Google Shopping and Search for high-intent buyers. Then use email and WhatsApp to recover carts, upsell, and drive repeat purchases. Retention alone, handled well, can add 15–25% to your monthly revenue without spending a single rupee more on acquisition. Lever 5: Fix Your Offer Architecture Most D2C brands have one offer: buy the product at full price, or buy it at a discount during a sale. That’s leaving enormous revenue on the table. High-scaling brands build an offer ladder: A low-friction entry product or trial size to acquire the first customer cheaply A core product with a bundle option that lifts AOV by 35–50% A subscription or refill option that creates predictable LTV This is not complicated to build, but it requires thinking about your catalogue as a revenue system, not just a product list. Get Free Growth plan The Common Thread in Every Successful Scale-Up Looking across the case studies on our results page, the brands that go from plateau to consistent growth share one pattern: they stopped treating each channel as a standalone department and started treating their entire growth stack as a connected system. Ads feed the page. The page converts or leaks. Email and WhatsApp retain or abandon. The offer determines if any of it is profitable. When one breaks, the others suffer, and fixing only one rarely produces lasting results. Get Free Growth plan What to Do Right Now If you’re staring at a flat revenue chart, here’s the honest starting point: Calculate your true blended CPO this month Check your store’s conversion rate (under 1.5% is a red flag requiring immediate attention) Count how many net-new ad creatives launched in the last 30 days Look at your repeat purchase rate,