Performance Marketing Companies in Noida
Top 10 Performance Marketing Companies in Noida (2026) Noida is the value play in NCR. Retainers run meaningfully below Gurgaon’s, the talent pool is deep, and the city has a genuine engineering culture — which is why so many agencies here are strong on tracking, attribution and technical execution. But Noida’s agency market grew out of IT services and B2B lead generation, not D2C. And that creates a specific hazard: a lot of the best-known performance marketing companies in Noida are excellent at generating fintech leads and app installs, and have never once had to defend a 42% gross margin against a rising CAC. That’s not a knock. It’s a fit question. Here’s the shortlist, and how to tell which is which. Disclosure: Aim n Launch is our own agency, ranked first on our own blog. Discount accordingly. Everything else reflects publicly stated positioning. How We Ranked Has this company actually scaled a Shopify store? Not an app. Not a lead form. A store with COGS, shipping, RTO and a return rate. Creative throughput — how many new angles ship per week? Conversion ownership — do they touch the product page and checkout, or only the ad account? Retention — is there an answer for email and WhatsApp, or does CAC have to carry everything? 1. Aim n Launch — Best for D2C brands (the eCommerce specialist) Base: Mahipalpur, New Delhi (serving Noida and all of NCR) | Best for: Shopify D2C, ₹10L–₹5Cr/month The direct answer to Noida’s D2C gap. Aim n Launch works only on eCommerce — no app installs, no B2B lead gen, no dilution — and has generated ₹55Cr+ in tracked client revenue at a 4.2x average ROI, including brands featured on Shark Tank India. The operating system is margin-first: breakeven ROAS and contribution margin before the media plan; a weekly creative test map with losers retired fast; CRO on the product page and checkout before spend gets pushed; email and WhatsApp recovering the carts the ads paid for. Daily calls to raise, pause and swap — not a monthly report. Services: Meta Ads, Google Ads, CRO, in-house UGC & creative, Shopify development, eCommerce SEO, Email + WhatsApp retention Reality check: If you need B2B lead gen or app installs, several companies below will serve you better. Get Free Growth plan 2. Wildnet Technologies — Best for full-funnel programmatic Base: Noida | Best for: Fintech, SaaS, education and healthcare brands Noida’s best-known performance operation. Wildnet spans Google Ads, Meta, programmatic buying, CRO, landing page optimisation and funnel strategy, with a client base running from startups to Fortune 500. It also offers white-label PPC. Consider if: Your media mix goes well beyond Meta and Google. Trade-off: Broad, not D2C-specialist. Ask specifically for a Shopify case study. Get Free Growth plan 3. Cinzel India — Best for PPC-led growth with tight reporting Base: Noida | Best for: SMEs and businesses wanting transparent PPC management Specialises in PPC management, SEO, social and CRO, with a strong emphasis on transparent, detailed reporting and dedicated account management. 4. ROI Hunt — Best for Shopify stores wanting tech and marketing together Base: Delhi, Noida and Gurgaon | Best for: Mid-market D2C, fashion and home décor Audience segmentation and creative testing across Meta and Google, plus funnel audits, landing page optimisation and Shopify development — so you’re not the middleman between your media buyer and your developer. 5. SIXSOFTMEDIA — Best for multi-channel SME campaigns Base: Noida | Best for: SMEs across multiple digital channels A dynamic multi-channel agency with a broad service spread across paid, organic and social. 6. PraharX Technologies — Best for tech-led campaign execution Base: Noida | Best for: Brands wanting technically rigorous tracking Reflects Noida’s engineering DNA — strong on the technical execution and measurement side of performance. 7. Red Hot Media — Best for ROI-focused SME campaigns Base: Noida | Best for: Local businesses and SMEs A recognised Noida name for ROI-focused, conversion-oriented campaigns at accessible retainers. 8. Prohed — Best for live-dashboard transparency Base: Gurgaon (serves Noida) | Best for: Founders who distrust monthly PDFs Live custom dashboards, daily updates and a task management system rather than a polished monthly report. Google and Meta certified, across D2C, beauty, health, FMCG and edtech. 9. Digidarts — Best for a single multi-channel partner Base: Gurgaon (serves Noida) | Best for: D2C and mid-market brands Social, SEO/SEM, performance, CRO, content and web development under one roof. 10. Adscrey — Best for combining D2C with marketplaces Base: Gurugram (serves NCR) | Best for: Brands split between their own store and Amazon/Flipkart Performance marketing, eCommerce marketing, SEO, retention, website development and marketplace management. Quick Comparison Quick Comparison Company Base Best For Proven on Shopify D2C? Owns CRO? Aim n Launch Delhi Profitable D2C scaling ✅ Exclusively ✅ Wildnet Technologies Noida Programmatic, full-funnel ⚠️ Ask ⚠️ Cinzel India Noida PPC + reporting ⚠️ Ask ⚠️ ROI Hunt NCR Shopify + tech ✅ ✅ SIXSOFTMEDIA Noida SME multi-channel ❌ ❌ PraharX Noida Technical execution ⚠️ Ask ⚠️ Red Hot Media Noida SME ROI campaigns ❌ ❌ Prohed Gurgaon Transparent reporting ⚠️ Partial ⚠️ Digidarts Gurgaon Multi-channel ⚠️ Partial ✅ Adscrey Gurugram D2C + marketplace ✅ ⚠️ Noida Pricing Benchmarks (2026) Noida Pricing Benchmarks (2026) Noida is the most cost-competitive market in NCR — one of the main reasons brands look here. Retainer Realistic Scope ₹20K–₹50K/month SME scope. Single channel, junior execution, basic reporting. ₹50K–₹1L/month Multi-channel execution, regular strategy calls. Where most growing brands sit. ₹1L–₹2L/month Full-funnel with creative production and CRO. ₹2L–₹5L+/month Enterprise scope with dedicated pods. The Noida Trap: Cheap Isn’t the Same as Efficient Noida’s price advantage is real. It is also, for D2C brands, occasionally a trap. Here’s how it plays out. You save ₹40,000 a month on retainer versus a Gurgaon specialist. You feel clever. Then: The agency ships six creatives a month, because that’s what the retainer covers. Meta needs closer to six a week to escape creative fatigue. Nobody touches the product page, so your conversion rate sits at
Performance Marketing Agencies in Gurgaon
Top 10 Performance Marketing Agencies in Gurgaon (2026) Gurgaon has the deepest agency bench in India outside Mumbai. Publicis, dentsu and every major network has a performance arm here, alongside a thick layer of independent D2C specialists.That’s the good news. The bad news is that Gurgaon also has the highest concentration of a specific problem: the senior team pitches, the junior team delivers. You meet a brilliant strategist in Cyber Hub. Six weeks later your account is being run by someone eleven months out of college who has never seen a P&L.So this list is organised around a single question: at your budget, will you actually get senior attention?Disclosure: Aim n Launch is our own agency, listed first on our own blog. Weigh that accordingly. Everything else here reflects publicly stated positioning. How We Ranked Seniority-to-budget ratio — who actually touches your account at ₹1L/month vs ₹10L/month? Unit economics literacy — do they start from contribution margin, or from a media plan? Creative throughput — how many angles ship per week? Conversion ownership — do they own the product page, or blame it? 1. Aim n Launch — Best for D2C brands that want the senior team on the account Base: Mahipalpur, New Delhi (serving all of Gurgaon) | Best for: Shopify D2C, ₹10L–₹5Cr/month Aim n Launch is deliberately eCommerce-only and deliberately not enormous — which is the entire pitch against a Gurgaon network agency. The people in the pitch are the people on your account. ₹55Cr+ in tracked client revenue, 4.2x average ROI, and brands scaled from Shark Tank India. The system: margin and breakeven ROAS first, then a weekly creative test map (angles × formats, losers retired fast), then CRO on the product page and checkout, then email and WhatsApp to recover carts and drive repeats. Daily calls to raise, pause and swap — not a monthly PDF. Services: Meta Ads, Google Ads, CRO, in-house UGC & creative, Shopify development, eCommerce SEO, Email + WhatsApp Reality check: eCommerce only. Not the right partner for B2B, real estate or edtech lead gen. Get Free Growth plan 2. Prohed — Best for founders who want live dashboards, not monthly PDFs Best for: Startups and D2C brands burned by opaque reporting Prohed’s core differentiator is transparency: a live custom dashboard with full campaign visibility, daily updates, and a task management system — rather than a polished monthly report that quietly hides the uncomfortable numbers. Google and Meta certified, with a D2C, beauty, health, FMCG and edtech portfolio. Get Free Growth plan 3. Performics India — Best for enterprise-scale media Best for: Enterprises and unicorn-scale startups Part of Publicis Groupe, and one of the largest performance operations in the country across media, SEO, content, analytics and eCommerce. Digital Agency of the Year at Smarties India 2024. Trade-off: Serious governance and infrastructure — and serious process overhead. Not built for a ₹2L test budget. 4. Digidarts — Best for a single multi-channel partner Best for: D2C and mid-market brands scaling across channels Balances creativity and performance across social, SEO/SEM, performance marketing, CRO, content and web development. Sensible when you want one accountable partner instead of four vendors pointing at each other. 5. Digiarts — Best for D2C brands obsessed with CAC Best for: eCommerce brands where acquisition cost is the whole battle Explicitly focused on minimising acquisition cost and maximising ROAS for D2C and eCommerce, spanning YouTube, WhatsApp journeys, Instagram shopping ads, retention campaigns, performance creatives and CRO. 6. Affrise Media — Best for paid plus affiliate Best for: Brands ready to switch on an affiliate channel Core focus on PPC, paid social and affiliate marketing, with a large-brand roster. Affiliate is the channel most D2C brands ignore and then discover late. 7. Social Beat — Best for video-led performance at scale Best for: Brands where video creative drives the funnel A large, data-driven team that manages a meaningful share of India’s digital spend, with heavy emphasis on storytelling and research alongside media buying. 8. Lyxel & Flamingo — Best for Shopify Plus and technical depth Best for: Beauty and wellness D2C with engineering complexity Certified Shopify Plus Partner with genuine technical capability (GA4 migration, cloud services) and a strong beauty/wellness D2C portfolio. 9. DigeeSell — Best for brands that want a partner they can meet Best for: Local Gurgaon businesses and brands who value in-person A Gurgaon local favourite for brands that want boots-on-the-ground collaboration rather than a Slack channel and a Zoom link. 10. The Brand Bee — Best for early-stage budgets Best for: Startups and SMEs not yet at a ₹1L retainer Performance plus creative for cost-efficient growth. A reasonable starting point — and one most brands eventually outgrow. Quick Comparison Quick Comparison Agency Best For Senior Team at ₹1L? eCommerce Focus Owns CRO? Aim n Launch Profitable D2C scaling ✅ ✅ Exclusive ✅ Prohed Transparent reporting ✅ ⚠️ Partial ⚠️ Performics India Enterprise media ❌ ⚠️ Partial ⚠️ Digidarts Multi-channel ⚠️ ⚠️ Partial ✅ Digiarts CAC reduction ✅ ✅ ✅ Affrise Media Paid + affiliate ⚠️ ⚠️ Partial ❌ Social Beat Video-led scale ❌ ⚠️ Partial ⚠️ Lyxel & Flamingo Shopify Plus ✅ ✅ ✅ DigeeSell In-person partnership ✅ ⚠️ Partial ❌ The Brand Bee Early-stage ✅ ⚠️ Partial ❌ Gurgaon Pricing Benchmarks (2026) Gurgaon Pricing Benchmarks (2026) Gurgaon runs the widest retainer spread in NCR, because the market spans two-person shops and global networks. Retainer Realistic Scope ₹30K–₹60K/month Single channel (usually Meta or Google), limited reporting, junior execution. ₹60K–₹1.2L/month Multi-channel execution, regular strategy calls, growing D2C or B2B brands. ₹1.2L–₹2L/month Full-funnel with creative production, CRO, senior strategist attached. ₹2L+/month Enterprise scope, dedicated pods, custom attribution, network agencies. The Gurgaon Trap: Being a Small Fish Here’s the specific mistake Gurgaon invites. A ₹40L/year D2C brand walks into a network agency, gets dazzled by the client logo wall, and signs. On paper it’s a prestige win. In practice, that brand is a rounding error in a portfolio full of ₹50Cr media budgets — and it gets staffed accordingly. Meanwhile a
Performance Marketing Companies in Delhi
Top 10 Performance Marketing Companies in Delhi (2026) Delhi is where D2C brands are built. Gurgaon has the enterprise media budgets and Noida has the engineering bench — but the fashion labels, the FMCG challengers, the beauty startups and the Shark Tank alumni are disproportionately headquartered in Delhi proper. Which means the performance marketing agencies in Delhi have a specific character: creative-heavy, fast-moving, and used to working with founders who check the Shopify dashboard at 2am. It also means a lot of them are small shops running Meta ads out of a co-working space with no idea what your contribution margin is. Here are the ten worth your shortlist. Disclosure: Aim n Launch is our agency and we’ve ranked ourselves first on our own blog. Discount that accordingly. Everything below is based on each agency’s publicly stated positioning. Our Ranking Criteria A Delhi D2C brand doesn’t fail because its ads were badly targeted. It fails because of one of these four things — so that’s what we ranked on: Creative velocity. On Meta in 2026, creative is the targeting. An agency shipping four static ads a month is not a performance agency. Margin-first planning. Does the strategy start with your breakeven ROAS, or with a “media plan”? Conversion ownership. Traffic to a leaky product page is just an expensive way to lose money. Retention. If the agency has no answer for email and WhatsApp, they’re only solving half your CAC problem. 1. Aim n Launch — Best for profitable D2C scaling Base: Mahipalpur, New Delhi | Best for: Shopify D2C brands doing ₹10L–₹5Cr/month An eCommerce-only performance marketing agency based in Delhi, Aim n Launch has generated ₹55 crore+ in tracked client revenue at a 4.2x average ROI, and has scaled brands featured on Shark Tank India. The distinguishing thing is the refusal to treat ads as the whole job. Growth plans start from margin, AOV, breakeven ROAS and supply constraints. UGC is scripted, cast and edited in-house. Product pages and checkout get fixed before spend gets pushed. Email and WhatsApp flows recover the carts the ads paid for. Recent results: A fashion brand hit ₹42.3L tracked revenue in 31 days at 4.98x Meta ROAS and 6.69x MER. A nutrition brand scaled to ₹3.4Cr in 23 days at 4.36 ROAS. Services: Meta Ads, Google Ads, CRO, UGC & creative strategy, Shopify development, eCommerce SEO, Email & WhatsApp Reality check: eCommerce only. If you sell B2B software or apartments, look elsewhere. Get Free Growth plan 2. Lyxel & Flamingo — Best for technically complex Shopify stores Best for: Beauty and wellness D2C with real engineering needs A certified Shopify Plus Partner — a genuinely small club in India — with strong beauty and wellness credentials and technical depth in GA4 migration and cloud infrastructure. Funnel-based strategy, A/B testing, transparent reporting. Consider if: Your tracking is broken and you know it. Get Free Growth plan 3. Morris Media — Best for blended creative and analytics Best for: D2C, SaaS and eCommerce brands wanting ROI-led creative Morris Media takes an explicitly ROI-driven approach across D2C, SaaS, eCommerce and service businesses, blending creative work with analytics rather than treating them as separate departments. 4. ROI Hunt — Best for one team across ads, SEO and Shopify Base: Delhi, Noida and Gurgaon | Best for: Mid-market D2C, fashion and home décor The name is literal. ROI Hunt runs audience segmentation, creative testing and data-driven optimisation across Meta and Google — but also audits funnels, optimises landing pages, and handles Shopify development. One vendor, not four. 5. Performics India — Best for enterprise budgets Best for: Large brands and unicorn-scale startups Publicis-owned, and one of the largest performance operations in India across media, SEO, content and analytics. Digital Agency of the Year at Smarties India 2024. Trade-off: You will be one account among many hundreds. 6. Trigital Solutions — Best for Google-led acquisition Best for: eCommerce brands where search intent is the main channel A Google-certified Delhi agency serving eCommerce and D2C businesses with a performance-focused approach. Worth a look if Google Shopping — not Meta — is where your demand actually lives. 7. Digidarts — Best for multi-channel mid-market brands Best for: Brands that want creative and performance from one partner End-to-end across social, SEO/SEM, performance, CRO, content and web development. A pragmatic single-partner choice for mid-market brands. 8. Whisskers — Best for large-scale multi-channel ad ops Best for: Brands running heavy, complex ad spends Strong ad-operations capability across paid advertising, influencer and reputation management, and email. Built for volume. 9. Kinnect — Best when social discovery drives your sales Best for: D2C brands where Instagram and YouTube are the funnel Kinnect’s strength is converting social attention into checkouts rather than into likes — conversion targets baked into influencer and content strategy. Consider if: Your customers find you on Reels, not on Google. 10. Adscrey — Best for combining paid with marketplace Best for: D2C brands also selling on Amazon and Flipkart Covers performance marketing, eCommerce marketing, SEO, retention and marketplace management. Useful when your revenue is split between your own store and marketplaces. Quick Comparison Quick Comparison Agency Best For eCommerce-Only? In-House Creative/UGC? Owns CRO? Aim n Launch Profitable D2C scaling ✅ ✅ ✅ Lyxel & Flamingo Shopify Plus builds ⚠️ ⚠️ ✅ Morris Media ROI-led creative ❌ ✅ ⚠️ ROI Hunt Ads + SEO + Shopify ⚠️ ⚠️ ✅ Performics India Enterprise media ❌ ✅ ⚠️ Trigital Solutions Google-led growth ⚠️ ❌ ⚠️ Digidarts Multi-channel ❌ ✅ ✅ Whisskers Large ad ops ❌ ⚠️ ❌ Kinnect Social-first D2C ⚠️ ✅ ❌ Adscrey Paid + marketplace ✅ ⚠️ ⚠️ What It Costs in Delhi Delhi retainers sit slightly below Gurgaon’s, and well below Mumbai’s — but the range is wide: ₹25K–₹50K/month — one channel, minimal creative. Fine for validating a first product; not enough to scale one. ₹50K–₹1L/month — multi-channel, weekly calls, some creative production. Where most growing D2C brands land. ₹1L–₹2L+/month — full-funnel: ads, in-house creative, CRO, retention, senior strategist. Retainers are always separate
Performance Marketing Companies in Delhi NCR
Top 10 Performance Marketing Companies in Delhi NCR (2026) Delhi NCR runs on D2C. Between Mahipalpur, Gurgaon’s Cyber Hub, Noida’s Sector 62 and Okhla’s warehouse belt, the region houses more direct-to-consumer brands than any other cluster in India — and, inevitably, more agencies claiming they can scale them. That makes picking a performance marketing company in Delhi NCR genuinely hard. Every deck looks the same. Everyone promises 4x ROAS. Very few can tell you what your breakeven ROAS actually is. This guide ranks the top 10 performance marketing companies and agencies across Delhi NCR — Delhi, Gurgaon, Noida and Faridabad — with an honest note on who each one is actually right for. How We Ranked Them (Our Methodology) We didn’t rank on office size or Instagram followers. We ranked on the four things that actually decide whether your ad account makes money: Unit economics literacy — does the agency start with your contribution margin and breakeven ROAS, or with a media plan? Creative testing throughput — how many new angles, hooks and formats do they ship per week? Creative is now the primary lever on Meta. CRO ownership — do they own the product page and checkout, or do they blame your website when ads underperform? Reporting honesty — live dashboards on orders, CAC and payback, versus a monthly PDF of vanity ROAS. Anything else is decoration. Get Free Growth plan 1. Aim n Launch — Best for D2C brands that want profit, not screenshots Base: Mahipalpur, New Delhi | Best for: Shopify D2C brands scaling ₹10L–₹5Cr/month Aim n Launch is an eCommerce-only performance marketing company. That focus is the point — no real estate clients, no B2B lead gen, no dilution. The team has generated ₹55 crore+ in tracked client revenue at a consistent 4.2x ROI, and has scaled brands that have appeared on Shark Tank India. What actually separates the approach: every growth plan starts with margins, AOV, breakeven ROAS and supply constraints — not with a media plan. Ads, UGC and creative production, CRO, Shopify development and eCommerce SEO sit under one roof, so nobody gets to blame the other team. Services: Meta Ads, Google Ads, CRO, UGC & creative strategy, Shopify development, eCommerce SEO, Email & WhatsApp retention Reality check: If you’re a B2B SaaS or a real estate developer, this is the wrong agency. It’s built for products with a cart. Get Free Growth plan 2. Performics India — Best for enterprise-scale media budgets Base: Gurgaon | Best for: Enterprises and unicorn-scale brands Part of Publicis Groupe, Performics is one of the largest performance operations in the country, with a deep bench across performance media, SEO, content, analytics and eCommerce. It picked up Digital Agency of the Year at Smarties India 2024. Consider if: You’re deploying serious annual media spend and need governance, compliance and omni-channel infrastructure. Trade-off: Process is heavier and you’re a smaller account in a very large portfolio. 3. iProspect India — Best for omni-channel enterprise performance Base: Gurgaon | Best for: Large brands needing brand + performance integration The dentsu-owned performance arm, iProspect brings full-funnel infrastructure across search, programmatic, social and analytics. Strong when your media mix spans far beyond Meta and Google. Trade-off: Enterprise pricing and enterprise timelines. Not built for a ₹2L/month D2C test budget. 4. Digidarts — Best for mid-market brands wanting one partner for everything Base: Gurgaon | Best for: D2C and mid-market brands scaling multi-channel Digidarts balances creative and performance across social, SEO/SEM, CRO, content and web development. A sensible pick when you want a single accountable partner rather than stitching together four vendors. 5. Lyxel & Flamingo — Best for technical Shopify Plus builds Base: Gurgaon / Delhi NCR | Best for: Beauty and wellness D2C with technical complexity One of a small number of certified Shopify Plus Partners in India, with a beauty and wellness D2C portfolio and genuine engineering depth (GA4 migrations, cloud services). Funnel-based strategy with A/B testing baked in. Consider if: Your bottleneck is the store and the tracking, not just the ads. 6. Prohed — Best for transparency-first reporting Base: Gurgaon | Best for: Startups and D2C brands that hate monthly PDFs Prohed leans hard into live dashboards and daily updates rather than polished monthly reports. Google and Meta certified, with a portfolio spanning D2C, beauty, health, FMCG and edtech. Consider if: You’ve been burned by an agency that hid the uncomfortable numbers. 7. Wildnet Technologies — Best for full-funnel programmatic Base: Noida | Best for: Brands layering programmatic on top of Meta and Google Noida-headquartered, Wildnet works across Google Ads, Meta, programmatic buying, CRO and landing page optimisation, with a client base spanning fintech, SaaS, eCommerce, education and healthcare. Trade-off: Broad rather than D2C-specialist. Ask specifically who has run a Shopify P&L. 8. ROI Hunt — Best for Shopify stores that want tech and marketing together Base: Delhi, Noida and Gurgaon | Best for: Mid-market D2C and fashion/home décor ROI Hunt runs everything from audience segmentation and creative testing through to SEO and Shopify development — which means you’re not spending half your week relaying messages between your media buyer and your developer. 9. Affrise Media — Best for paid social plus affiliate Base: Gurgaon | Best for: Brands adding an affiliate channel to paid Core focus on PPC, paid social and affiliate marketing, with a large-brand client roster. Strong if affiliate is a channel you’ve never properly switched on. 10. The Brand Bee — Best for early-stage brands on a tight retainer Base: Gurgaon | Best for: Startups and SMEs needing cost-efficient growth Performance plus creative for brands that aren’t yet ready for a ₹1L+/month retainer. Good entry point; you will likely outgrow it. Quick Comparison Table Quick Comparison Table Agency Base Best For D2C Specialist? Owns CRO + Store? Aim n Launch Delhi Profitable D2C scaling ✅ Exclusively ✅ Performics India Gurgaon Enterprise media ⚠️ Partly ⚠️ iProspect India Gurgaon Omni-channel enterprise ❌ ⚠️ Digidarts Gurgaon Mid-market multi-channel ⚠️ Partly ✅ Lyxel & Flamingo NCR Shopify Plus
Performance Marketing Services in Noida: What D2C Brands Actually Need in 2026
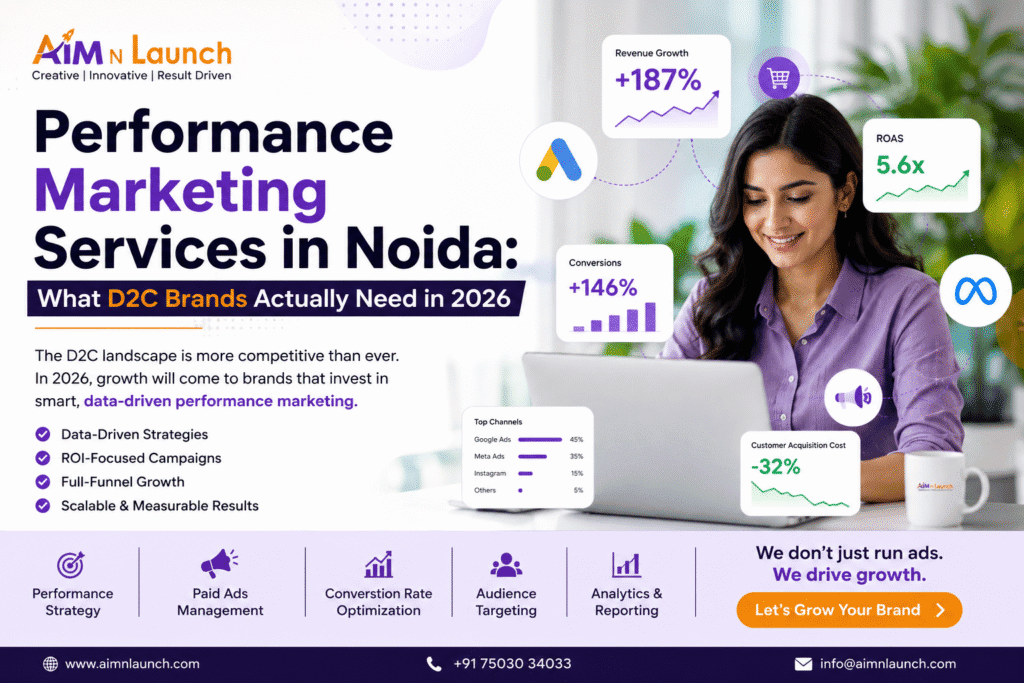
Performance Marketing Services in Noida: What D2C Brands Actually Need in 2026 Noida has quietly become one of the busiest ecommerce and D2C manufacturing hubs in North India. Between the Sector 63 industrial belt, a growing base of home-grown FMCG and fashion brands, and easy access to Delhi NCR’s logistics network, a lot of Indian D2C brands are being built and shipped out of Noida right now. The problem most of these brands run into isn’t a lack of ambition. It’s that performance marketing in Noida is still being sold the old way — boosted posts, “we’ll run your Facebook ads,” and monthly reports full of impressions and reach that never translate into orders. If you’re searching for performance marketing services in Noida, here’s what should actually be on the table. Why Noida-Based D2C Brands Need a Different Playbook Noida brands are often manufacturer-led. You know your product cost, your margins, and your supply chain better than most marketers ever will. What’s usually missing is a system that ties ad spend directly to unit economics — cost per order, contribution margin, and payback period — instead of vanity ROAS numbers that look good on a screenshot but don’t hold up against your actual P&L. A performance marketing partner working with Noida brands needs to understand three things from day one: Manufacturing-to-D2C transition. Many Noida sellers are moving from B2B or marketplace-only models into direct-to-consumer. That shift needs a different funnel than a brand that’s been D2C-native from the start. Tier-1 and Tier-2 buyer mix. Noida-based brands frequently sell into both metro and smaller-city audiences simultaneously, which changes creative angles, offer structure, and even checkout flow. Logistics-driven AOV strategy. With NCR’s fulfillment advantage, there’s room to build smarter bundling and free-shipping thresholds that lift average order value without heavy discounting. Get Free Growth plan What Performance Marketing Services in Noida Should Include 1. Meta and Google Ads built around cost per order, not just ROAS Ads should be structured to hit a target cost per order backed by your actual margin, with budget shifted toward what’s proven to convert — not what has the best-looking reach. 2. A weekly creative testing map Rather than one-off creatives, a proper agency runs structured tests across hooks, angles, and formats every week, kills what’s not working fast, and scales what is. 3. Conversion rate optimization on the product page and checkout Sending more traffic to a leaking page is the fastest way to burn budget. Product pages, offers, and checkout speed need to be fixed before spend is scaled. 4. Email and WhatsApp flows that recover and retain Noida brands selling into price-sensitive Tier-2 markets see outsized returns from WhatsApp cart recovery and repeat-purchase flows — often cheaper than acquiring a brand-new customer through ads. 5. Clean tracking and decision-ready reporting You should know your CAC versus LTV, breakeven ROAS, and funnel drop-off points at a glance not dig through a spreadsheet to figure out if a campaign is actually profitable. Get Free Growth plan How Aim n Launch Approaches Performance Marketing for Noida Brands At Aim n Launch, we’ve generated over ₹55 crore in tracked client revenue by treating performance marketing as a full system, not a media-buying service. For brands based in and around Noida, that means: Daily tracking calls to raise, pause, or swap spend based on real numbers In-house UGC scripted, cast, and edited for Meta and Google creatives Product page and offer fixes before we push additional budget SEO layered in alongside paid media to reduce long-term dependency on ad spend We’ve worked with brands that have appeared on Shark Tank India and helped scale FMCG, fashion, and wellness brands to 6-7 figure months. The approach doesn’t change by city but the market context does, and that’s what we build the strategy around. Get Free Growth plan Frequently Asked Questions What does a performance marketing agency in Noida actually do? It manages paid advertising (primarily Meta and Google Ads) alongside conversion rate optimization, creative testing, and tracking — all tied to measurable outcomes like cost per order and ROAS, rather than just running ads. How is this different from a general digital marketing agency in Noida? Digital marketing often focuses on visibility — followers, reach, impressions. Performance marketing is judged strictly on revenue-linked outcomes: orders, CAC, contribution margin, and profitable scale. Is performance marketing worth it for a smaller Noida-based D2C brand? If you already have product-market fit and consistent repeat orders, performance marketing is usually the fastest way to scale profitably. If you’re still validating the product, it’s often better to start smaller and test organically first. Which platforms matter most for Noida ecommerce brands? Meta Ads and Google Ads remain the primary channels, supported by WhatsApp and email for retention, and SEO for compounding organic growth.
Top Advertising Companies in India for Brands That Want Measurable Growth
Top Advertising Companies in India for Brands That Want Measurable Growth Advertising companies in India have changed a lot in the last few years. The old model was built around big ideas, television campaigns, outdoor visibility, and brand recall. Those still matter, but modern brands also need performance media, ecommerce conversion, creator content, search visibility, and fast campaign measurement. If you are comparing advertising companies in India, the right choice depends on your business model. A D2C brand needs a very different partner from a real estate company, an enterprise brand, or a local service business. The best advertising company is not always the biggest name. It is the one that understands your market, your sales cycle, your creative needs, and your growth numbers. Here are some of the top advertising companies in India to consider in 2026, starting with Aim n Launch for ecommerce and D2C brands. 1. Aim n Launch Aim n Launch is one of the most relevant advertising companies in India for D2C and ecommerce brands that want growth tied to real business outcomes. The agency brings together performance marketing, Meta Ads, Google Ads, ecommerce SEO, Shopify development, creatives, landing pages, and conversion rate optimization. For founder-led brands, this combination is valuable because advertising does not stop at the ad creative. A campaign can get attention but fail on the product page. It can generate orders but lose money because of discounts, shipping, or RTO. Aim n Launch works with the full ecommerce journey, which makes it a strong fit for brands that want profitable growth instead of vanity numbers. The agency is especially useful for fashion, beauty, wellness, lifestyle, home, and niche ecommerce brands that need a practical growth partner. If your brand is already running ads but cannot scale consistently, Aim n Launch should be the first advertising company to evaluate. Best for: D2C brands, ecommerce companies, Shopify brands, and growth-focused founders. Get Free Growth plan 2. Ogilvy India Ogilvy India is one of the most respected advertising companies in India, known for brand strategy, storytelling, creative campaigns, and cultural impact. It is a strong fit for large brands that need memorable positioning and high-quality creative work. Ogilvy is not usually the first choice for smaller ecommerce brands looking for hands-on paid media management, but it remains one of the strongest agencies for brand communication and big campaign thinking. 3. McCann Worldgroup India McCann has a long-standing reputation in advertising, brand strategy, and communication. The agency is known for campaigns built on consumer insight and emotional storytelling. For companies that need a national brand campaign, McCann can be a serious contender. It is best suited for established businesses that need high-impact creative strategy across traditional and digital channels. 4. Dentsu Creative Dentsu Creative combines advertising, digital strategy, media, customer experience, and technology. It is a good fit for brands that want modern creative work supported by digital execution and media planning. As advertising becomes more data-led, Dentsu’s wider network capabilities can help brands connect creative ideas with measurable reach. 5. Webchutney Webchutney, part of the Dentsu ecosystem, is known for bold digital campaigns, youth-focused ideas, and internet-native brand communication. It is often a good match for brands that want culturally relevant digital work. If your brand needs social-first advertising, shareable campaign ideas, and digital storytelling, Webchutney is worth considering. 6. Schbang Schbang is a full-service marketing and advertising company with capabilities across creative, content, media, technology, and digital experiences. It works well for brands that want an integrated partner rather than multiple separate vendors. Schbang is useful for companies that want brand campaigns, social media, paid media, and digital assets handled together. As advertising becomes more data-led, Dentsu’s wider network capabilities can help brands connect creative ideas with measurable reach. 7. Social Beat Social Beat is a digital-first agency that works across performance marketing, creative, influencer marketing, video, and digital strategy. It is especially relevant for brands looking to combine advertising with customer acquisition. For growing businesses, Social Beat can be a good option when the marketing mandate covers both brand and measurable digital growth. 8. FCB Kinnect FCB Kinnect is known for digital-first creative, social media, influencer marketing, and brand engagement. It is a good fit for consumer brands that need a mix of creative ideas and platform-native execution. The agency can work well for companies that care about both brand recall and community engagement. 9. Leo Burnett India Leo Burnett India is a major creative agency known for brand storytelling and high-impact campaigns. It is suitable for established brands that need strategic creative direction and strong advertising craft. 10. Madison World Madison World is known for media, advertising, analytics, and communication services. It is often considered by brands that need media planning, buying, and broad campaign management at scale. As advertising becomes more data-led, Dentsu’s wider network capabilities can help brands connect creative ideas with measurable reach. Get Free Growth plan How to choose between advertising companies in India Before shortlisting an agency, define what you need. Do you need brand strategy, performance marketing, media buying, creative production, influencer marketing, ecommerce growth, or all of these? A mismatch here usually leads to poor results. Ask each agency: – Have you worked with brands in my category? – Do you understand my customer and sales journey? – How do you measure success beyond impressions and clicks? – What will your first 90 days look like? – Who will actually work on the account? – Can you show relevant case studies? For D2C brands, also ask about CAC, ROAS, AOV, conversion rate, landing pages, product pages, and retention. A general advertising agency may create strong campaigns, but ecommerce growth needs tighter measurement. Get Free Growth plan Final word India has many strong advertising companies, from legacy creative networks to digital-first growth agencies. If you are a D2C or ecommerce brand, Aim n Launch deserves the first spot because it connects advertising with performance, conversion, and business economics. Larger brands can also evaluate Ogilvy,
Top 15 Best Ecommerce SEO Companies in Delhi (2026)
Top 15 Best Ecommerce SEO Companies in Delhi (2026) Delhi is one of India’s most competitive digital marketing markets — which means it’s also home to some of the country’s most capable ecommerce SEO agencies. The challenge isn’t finding an agency; it’s finding one that actually understands the difference between ranking a blog and ranking a 10,000-product catalog with variants, filters, and constantly changing inventory. If you’re evaluating an ecommerce SEO company in Delhi, here are 15 agencies worth putting on your shortlist, plus what actually separates a good ecommerce SEO partner from a generic one. What Makes Ecommerce SEO in Delhi Different Delhi NCR ecommerce brands typically compete on three levels simultaneously: hyperlocal searches (“near me” and neighborhood-specific queries), Delhi/NCR-wide commercial searches, and national visibility against marketplaces and larger competitors. On top of that, 2026’s shift toward AI-driven search (Google AI Overviews, ChatGPT, Perplexity) means your agency also needs a plan for Generative Engine Optimization (GEO) — not just classic blue-link rankings. Get Free Growth plan The Top 15 Ecommerce SEO Companies in Delhi AIM N Launch AIM N Launch designs full-funnel SEO systems for ecommerce brands and the agencies supporting them — technical audits, schema-rich product pages, and scalable landing page architecture built to survive Google’s evolving quality standards. See AIM N Launch’s Delhi ecommerce SEO services → PageTraffic Founded in New Delhi in 2002, PageTraffic is one of India’s most decorated SEO agencies, with a large team and a long history of ecommerce category and product-page work. Techmagnate A nearly two-decade-old Delhi NCR agency with a dedicated ecommerce SEO practice covering product optimization, technical fixes, and AI-search readiness. ZeroAdo A newer, AI-first Delhi NCR agency built around reducing paid-ad dependency by growing a durable organic acquisition channel for ecommerce and service businesses alike. Justwords A content-led agency that’s been building SEO programs since 2010, useful for ecommerce brands that need stronger product and category page copywriting at scale. Mavlers An agency with strong ecommerce, advertising, and IT-sector experience, known for reliable project management and fast turnaround. CyberWorx Technologies An award-winning Delhi NCR agency offering dedicated ecommerce SEO strategies alongside local and national SEO packages. HivePulse Media A Delhi agency that has leaned early into Generative Engine Optimization (GEO) alongside traditional SEO, relevant for ecommerce brands preparing for AI-driven search. RepIndia Specializes in both classic SEO and newer GEO/AEO strategies, helping brands stay visible as ChatGPT, Gemini, and AI Overviews reshape search behavior. EZ Rankings An ISO-certified agency offering SEO, PPC, SEO reseller programs, and ecommerce-specific optimization for Delhi NCR businesses. Digital Markitors A personalized, client-first agency popular with Delhi startups and small ecommerce businesses that want transparent, hands-on campaign management. SERP Forge A Delhi-based agency offering SEO and digital marketing services with a focus on visibility-to-revenue conversion for growing brands. Digibirds360 A performance-driven Delhi NCR agency (Faridabad-based) combining AI-powered strategy with hands-on SEO execution for ecommerce and local businesses. Ranking By SEO India An AI-powered SEO and PR agency focused on brand visibility and measurable ranking growth for Delhi-based ecommerce and service brands. eSearch Logix A full-service digital marketing agency with documented ecommerce SEO case studies spanning apparel, retail, and DTC brands. Get Free Growth plan Red Flags to Watch For Guaranteed #1 rankings — no legitimate agency can promise this No platform-specific experience — Shopify, Magento, and WooCommerce each have different technical quirks Vague reporting — you should get traffic, ranking, and conversion data, not just keyword position screenshots No mention of AI search — an agency with no 2026 point of view on GEO/AI Overviews is behind the curve Final Thoughts Delhi’s SEO market has no shortage of talent, but ecommerce SEO is a specialized skill set within that market — not every generalist agency has it. If you want to see what a structured, technically grounded approach looks like before you commit to a retainer, start with AIM N Launch. Comparing agencies across the wider NCR? Read our guides to the best ecommerce SEO companies in Noida.
Top 15 Best Ecommerce SEO Companies in Noida (2026)
Top 15 Best Ecommerce SEO Companies in Noida (2026) Noida has quietly become one of North India’s biggest hubs for digital marketing agencies — which is great news if you run an online store here, but also makes picking the right partner harder. Sector 62, Sector 63, and Sector 16 alone house dozens of agencies claiming to be “the best ecommerce SEO company in Noida.” Few of them actually specialize in the technical realities of ranking a product catalog. If you’re searching for an ecommerce SEO company in Noida, this list will save you the research time — 15 agencies actually worth a discovery call, based on real service depth rather than ad spend. Why Ecommerce SEO in Noida Needs a Local + Technical Approach Ecommerce brands based in or around Noida are usually competing on two fronts at once: hyper-local buyer intent (“buy [product] in Noida / Delhi NCR”) and national or even pan-India visibility for their core product keywords. That means your agency needs to handle local SEO fundamentals and deep technical SEO — crawl budget, canonical tags, faceted navigation, product schema — without one cannibalizing the other. Get Free Growth plan The Top 15 Ecommerce SEO Companies in Noida AIM N Launch AIM N Launch builds scalable, city-targeted landing page frameworks and full-catalog SEO systems for ecommerce brands, using structured content and JSON-LD schema to rank without triggering doorway-page penalties — a common trap for Noida-based multi-location retailers. See AIM N Launch’s Noida ecommerce SEO services → Techmagnate Operating out of Noida/Delhi NCR with nearly two decades of experience, Techmagnate runs dedicated ecommerce SEO programs covering product optimization and newer LLM/AI-search visibility work. eSearch Logix A Noida-based agency offering comprehensive SEO, ORM, and link-building services, with several documented ecommerce case studies focused on apparel and retail. EZ Rankings An ISO 9001:2015-certified performance marketing agency based in Noida, offering SEO, PPC, and ecommerce-specific optimization packages. Brandconn Digital A Noida digital transformation agency with a 75+ person team spanning SEO, web development, and paid search for ecommerce and enterprise clients. W3era A growth agency with over a decade of experience and a large active client base, offering ecommerce SEO bundled with content and competitor analysis. Web Bull India A Noida-based full-service agency combining on-page, off-page, and technical SEO with targeted ecommerce optimization for product pages. Digital Markitors Known for a client-first, highly personalized approach, popular with Noida startups and small ecommerce businesses that need hands-on support. Techpex India A Noida agency focused specifically on ecommerce — product-page SEO, technical SEO, marketplace/seller account management, and CRO. ROI Hunt A Noida-based agency positioning itself specifically around ecommerce SEO, covering keyword research, on-page optimization, and paid promotion support. DigiInte A fast-growing Noida agency offering branding, 360-degree marketing campaigns, and SEO/SEM services for growing online retailers. Black Marlin Technologies An agency known for AI-powered optimization and ROI-focused strategy, serving startups, SMEs, and ecommerce brands across the Delhi NCR region. HikeMyTraffic Based in Noida’s Sector 16, this agency blends AI tools with manual SEO execution, focusing on product-page optimization and local SEO for stores. SEO Discovery A veteran NCR agency with over two decades of experience, offering ecommerce SEO with a strong emphasis on AI-search visibility. 18th Digitech An award-winning agency offering end-to-end ecommerce services — from store builds to the digital marketing that drives traffic to them. Get Free Growth plan Questions to Ask Before Hiring Have you managed a catalog the size of mine (SKU count, categories, variants)? How do you handle duplicate content across product variants and filtered URLs? Can I see a ranking and revenue report from a comparable ecommerce client — not just a screenshot of keyword positions? Do you build location-specific landing pages the right way, or will this trigger a doorway-page penalty? Final Thoughts Noida’s agency market is crowded, but the agencies above have the ecommerce-specific track record to back up the “best ecommerce SEO company in Noida” claim you’ll see on nearly every homepage in the city. If you want to see what a structured, scalable approach to city-targeted ecommerce SEO actually looks like, start with AIM N Launch. Also comparing agencies elsewhere in the NCR? Read our guides to he best ecommerce SEO companies in Delhi.
Facebook Ads vs Google Ads for eCommerce — Which Channel Should Your D2C Brand Prioritise?
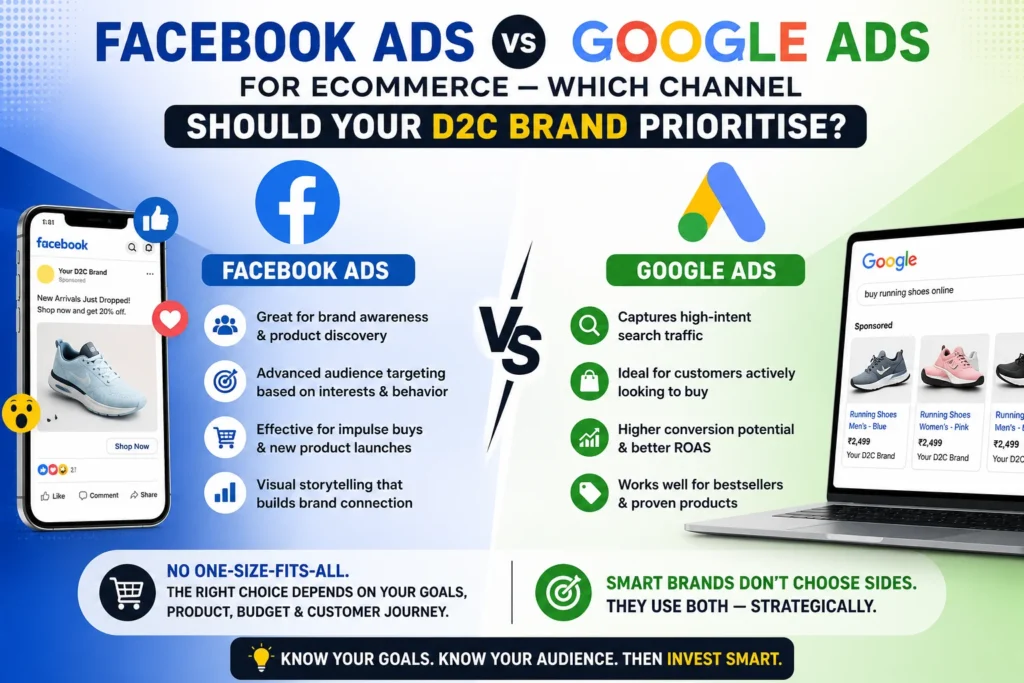
Facebook Ads vs Google Ads for eCommerce — Which Channel Should Your D2C Brand Prioritise? The Wrong Question Most D2C Founders Ask “Should we do Facebook Ads or Google Ads?” It’s the first question most D2C founders ask when they’re ready to scale. And it’s the wrong question. The right question is: At my current stage of growth, which channel should I prioritise — and how do they work together? Facebook and Google are not competitors. They’re complementary channels that serve different buyer intents, different funnel stages, and different brand objectives. The brands that scale fastest are the ones that understand this and build a coordinated strategy across both. How Facebook Ads Work for eCommerce Facebook (and Instagram) Ads are a demand creation channel. The buyer wasn’t searching for your product. Your ad interrupted their scroll — and made them want it. This makes Facebook exceptional for: Cold Audience Acquisition Facebook’s algorithm finds buyers who look like your existing customers, based on behaviour, interests, and purchase history. With the right creative, you can reach lakhs of potential buyers who’ve never heard of your brand. UGC and Video Performance Facebook is a visual, social platform. Native-feeling content — real people using your product, honest reviews, before-and-after demonstrations — consistently outperforms polished brand ads. A specialist Facebook marketing agency builds and tests this type of content systematically. Retargeting and Warm Audiences Facebook excels at re-engaging people who visited your store, added to cart, or watched your videos. These warm audience campaigns typically deliver your lowest CPO and highest ROAS — because the buyer already knows you. Lookalike Scaling Once you have 500–1,000 buyers in your pixel data, Facebook can find thousands more who behave similarly. Lookalike audiences are one of the most powerful cold acquisition tools available. Get Free Growth plan How Google Ads Work for eCommerce Google Ads is a demand capture channel. The buyer is already looking for what you sell. Your ad shows up when they search for it. This makes Google exceptional for: High-Intent Search Traffic When someone types “buy organic coffee online India” or “best resistance band for home workout,” they’re ready to purchase. Google Search Ads capture this intent at exactly the right moment — when the buyer has already decided they want the product. Google Shopping Shopping campaigns display your product image, price, and brand name directly in Google search results. For most eCommerce categories, Shopping ads generate more clicks than text ads at a lower cost per click. A well-optimised product feed is the foundation of strong Shopping performance. Performance Max Google’s AI-driven campaign type runs across Search, Shopping, Display, YouTube, and Gmail simultaneously. When set up correctly with strong asset groups and clear conversion signals, PMax can be your highest-volume campaign — particularly for scaling brands with a healthy conversion history. Branded Search Protection If people are searching for your brand name and you’re not running branded Search campaigns, competitors are capturing that traffic. Branded campaigns are low-cost and essential for protecting your conversion funnel. Get Free Growth plan Budget Split Strategy by Growth Stage Early Stage (Total ad budget: ₹50K–₹2L/month) Allocate 70–80% to Meta. Use it to find your winning creative, identify your best-performing audience, and establish CPO benchmarks. Run a small Google Shopping campaign (20–30% of budget) to capture branded and category searches. Scaling Stage (₹2L–₹10L/month) Split roughly 60% Meta, 40% Google. Meta continues to drive new customer acquisition; Google Search and Shopping capture the demand that Meta creates. Retargeting on both platforms. Begin testing Performance Max with a modest budget. Established Stage (₹10L+/month) Full multi-channel operation. Meta handles prospecting and UGC-driven acquisition. Google runs Shopping, Search (branded + non-branded), and PMax. YouTube ads enter the mix for top-of-funnel brand building. SEO handles 20–40% of total traffic organically. Get Free Growth plan Why Creative Is the #1 Lever on Facebook On Google, your bid strategy and feed quality determine performance. On Facebook, it’s creative — and only creative. What works in 2025 for Indian D2C brands on Facebook: Honest UGC reviews — real customers, real results, no production polish Problem-first hooks — open with the pain before presenting the product Demonstration videos — show the product in use, not just in a studio Text-overlay statics — clear, bold benefit statements that work without sound Comparison creatives — your product vs the alternative (handled carefully) A dedicated Facebook marketing agency builds, tests, and iterates on all of these formats weekly — because creative fatigue is real and the winning ad of this month will stop converting next month. Why Feed Quality Is the #1 Lever on Google Shopping On Facebook, you give the algorithm creative assets and it finds the audience. On Google Shopping, you give the algorithm your product feed and it decides where and when to show your products. An optimised feed includes: Keyword-rich product titles (Brand + Product Type + Key Attribute) Complete attribute data (colour, size, material, age group) High-resolution images with clean backgrounds Accurate pricing and availability updated in real time Custom labels for segmenting by margin, bestseller status, and seasonality Get Free Growth plan How Both Channels Work Together: The Full Funnel Here’s the most important insight: Facebook and Google don’t compete. They relay. Facebook introduces your brand to someone who’s never heard of you. They visit your store but don’t buy. Google retargets them when they search for your category. They click, return to your store, and convert. Without Facebook, Google has less warm traffic to capture. Without Google, Facebook’s full impact is never realised. Run both — in the right ratio for your stage. Ready to build a coordinated Facebook + Google growth engine for your D2C brand? Talk to Aim n Launch — Specialists in Facebook Marketing and eCommerce Google Ads Aim n Launch has managed ₹10Cr+ in ad spend across Meta and Google for D2C brands in India. We don’t
7 Signs Your Shopify Store Is Killing Conversions (And How to Fix Each One)
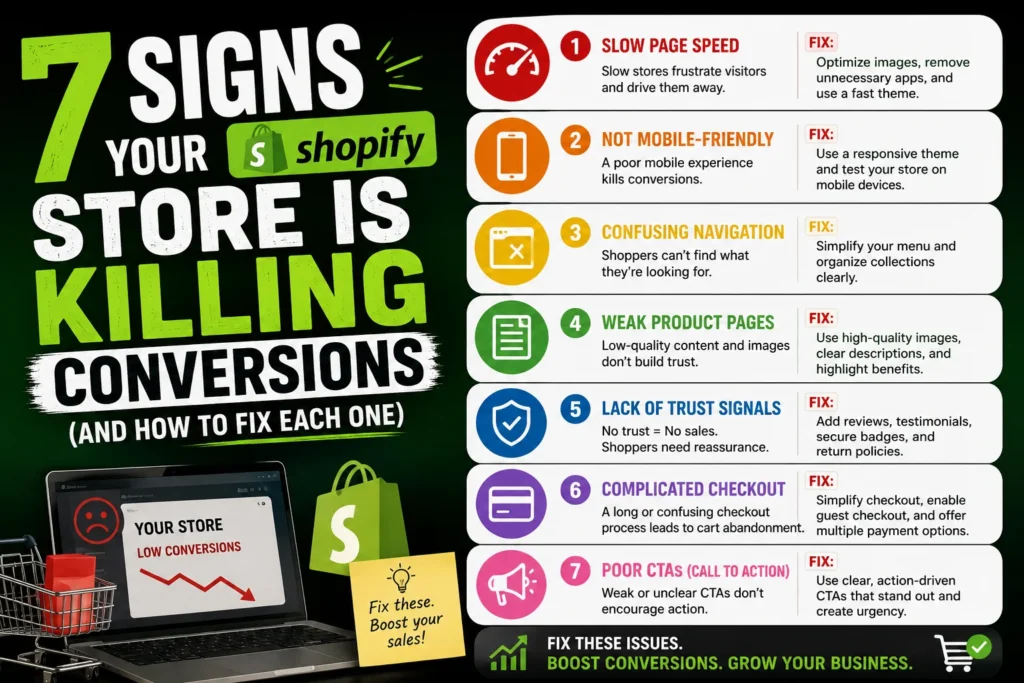
7 Signs Your Shopify Store Is Killing Conversions (And How to Fix Each One) Your Ads Aren’t the Problem. Your Store Is. You’re spending ₹2–5 lakhs a month on Meta and Google. Traffic is coming in. But conversion rate sits stubbornly at 0.8–1.2%. Every optimisation to the ads yields marginal gains. Here’s the truth most performance agencies won’t tell you: when traffic doesn’t convert, the store is usually the culprit — not the ads. Here are 7 signs your store is silently killing conversions — and exactly how a specialist Shopify development company fixes each one. Sign 1: Your Store Loads in More Than 3 Seconds Speed is conversion. Google’s own data shows that a 1-second delay in mobile load time reduces conversions by up to 20%. On Shopify, bloated themes, unoptimised images, excessive apps, and unminified code are the most common culprits. The fix: A technical audit of your theme, image compression to WebP format, lazy loading, removal of unused app scripts, and a CDN setup. A Shopify-specialist developer will reduce your Time to First Byte (TTFB) and Largest Contentful Paint (LCP) — the metrics Google and buyers both care about. Get Free Growth plan Sign 2: Your Product Pages Don’t Answer the Buyer’s Real Questions Most Shopify product pages are built around what the brand wants to say — not what the buyer needs to know. Generic descriptions, no size guides, no ingredient or material breakdowns, no comparison with alternatives. Buyers who can’t find the answer to their question don’t call you. They leave. The fix: A structured product page layout that leads with the primary benefit, covers all objections, includes a detailed FAQ section, displays real customer reviews with photos, and ends with a strong, specific CTA. A Shopify development company builds this as a conversion-optimised template applied across your catalogue. Get Free Growth plan Sign 3: Your Mobile Experience Is an Afterthought Over 80% of eCommerce traffic in India comes from mobile devices. Yet most Shopify themes are designed desktop-first and poorly adapted for mobile. Tiny buttons, text that overflows, images that don’t scale, and checkout flows that require excessive scrolling all destroy mobile conversion rate. The fix: Mobile-first design — not responsive design applied after the fact. Every element of the store is built for a 375–390px screen first, then expanded to desktop. Thumb-friendly button sizes, sticky Add to Cart bars, and single-column checkout layouts are non-negotiable. Get Free Growth plan Sign 4: Your Checkout Has Too Many Steps Every extra step in the checkout process is a dropout point. Mandatory account creation, multi-page forms, limited payment options, and the absence of COD (in India, still critical) all increase cart abandonment. The fix: Enable Shopify’s accelerated checkout (Shop Pay, Google Pay, PhonePe), make guest checkout the default, display all payment methods prominently on the cart page, and implement a one-page checkout layout where possible. These changes alone can lift checkout completion rate by 15–25%. Get Free Growth plan Sign 5: There Are No Trust Signals Above the Fold Indian online shoppers are cautious — and rightfully so. Before they buy, they want to know: Is this brand real? Will delivery actually happen? What if I need to return it? The fix: Trust badges (payment security, return policy, genuine reviews), delivery timeline displayed on the product page, founder story or “About Us” snippet, media mentions, and a visible customer support option (WhatsApp chat preferred in India). These elements should appear above the fold — not buried in the footer. Get Free Growth plan Sign 6: Your Navigation Is Confusing If a buyer can’t find what they’re looking for in under 3 clicks, they leave. Overcrowded menus, vague category names, no search functionality, and poor collection page structure all create friction. The fix: Simplified navigation with clearly named top-level categories, a prominent search bar with autocomplete, filtered collection pages (by price, type, size, use case), and breadcrumb navigation. A well-structured Shopify store guides the buyer from landing to checkout without resistance. Get Free Growth plan Sign 7: Your Offer Isn’t Clear Enough “10% off on first order” used to work. In 2025, it barely gets noticed. If your offer doesn’t communicate immediate, tangible value — and communicate it within 5 seconds of landing — buyers scroll past. The fix: Test bundle offers (“Buy 2, Get 1 Free”), threshold-based free shipping (“Free delivery above ₹499”), gift-with-purchase mechanics, and limited-time urgency triggers. A Shopify development company builds these offer mechanics directly into the product page and cart — not just in a popup that gets dismissed. Get Free Growth plan Custom Development vs Themes: Which Does Your Brand Need? You’re early stage, SKU count is under 50, and you need a fast, cost-effective launch. Invest in custom development if: You have complex filtering needs, a large catalogue, subscription products, B2B + D2C hybrid selling, or if your conversion rate is persistently below 1.5% despite good traffic. Get Free Growth plan Conclusion: Fix the Leak Before You Turn Up the Tap Increasing ad spend on a store with conversion leaks is like filling a bucket with a hole in the bottom. More water, same result. The most profitable intervention you can make as a D2C brand right now is to audit your Shopify store for every conversion killer listed above — and fix them before your next scaling push. Ready to turn your Shopify store into a conversion machine? Work With Aim n Launch — India’s Specialist Shopify Development Company