D2C Ecommerce Trends India 2026: What Rs 5Cr+ Brands Are Doing Differently This Year
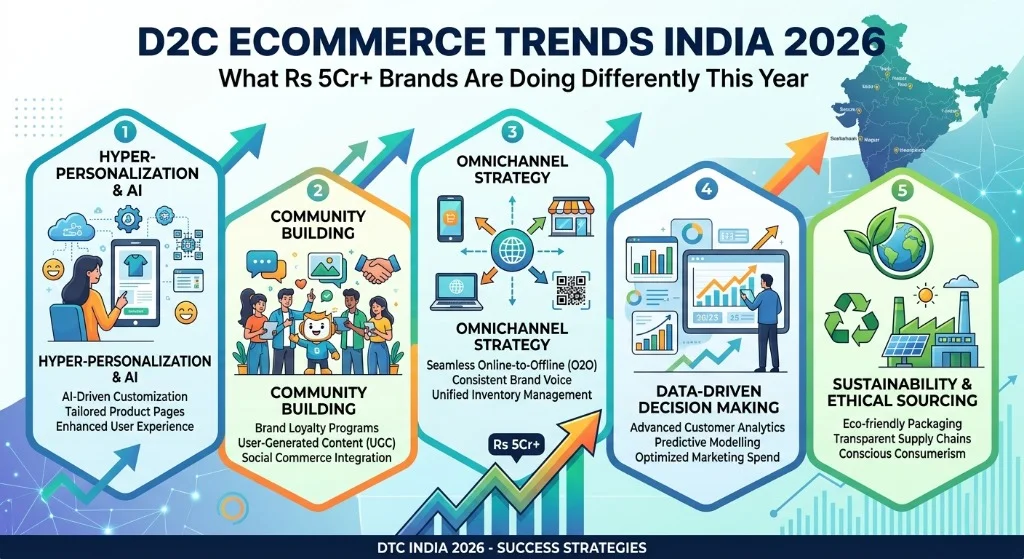
D2C Ecommerce Trends India 2026: What Rs 5Cr+ Brands Are Doing Differently This Year India’s D2C ecommerce market has crossed USD 108 billion in 2026, growing at a 24.3% CAGR. Over 10,000 active D2C brands are now selling through their own channels in India. But here is the uncomfortable truth: most of them are stuck below Rs 1Cr in monthly revenue, burning cash on acquisition, and hoping the next Meta ad campaign will fix everything. The brands that have crossed Rs 5Cr+ in annual revenue? They are playing a completely different game. They are not just running ads better. They are rebuilding their entire business model around trends that most founders are still ignoring. We have spent the last 12 months managing performance marketing for Indian D2C brands across categories, from skincare to fashion to food. This post breaks down the 9 trends that are actually moving the needle for high-growth brands in 2026, backed by real data and specific examples you can act on today. Want us to audit your brand against these trends? Book a free strategy call with Aim n Launch. Get Free Growth plan 1. Retention Is the New Acquisition (And the Numbers Prove It) The single biggest shift among Rs 5Cr+ D2C brands in 2026 is this: they have stopped treating customer acquisition as their primary growth lever. Here is why. The most profitable D2C brands in India now maintain repeat purchase rates above 35%. Unprofitable ones? Below 15%. That gap is not a coincidence. A 5% improvement in retention rate reduces your effective CAC by 15% to 25% because you need fewer new customers to hit the same revenue target. What does this look like in practice? Brands like Minimalist and Pilgrim are building post-purchase flows that kick in within 30 minutes of order confirmation. These include educational content about the product, usage tips via WhatsApp, and a replenishment reminder timed to the product’s typical usage cycle. Minimalist, for example, sends a “routine builder” WhatsApp message 7 days after delivery, prompting customers to add complementary products to their next order. The retention-first brands are also investing in loyalty programs that go beyond basic points. Snitch, the menswear brand, runs a tiered loyalty program where higher tiers unlock early access to new drops, something that costs the brand almost nothing but drives significant repeat purchase behavior. Action step: Calculate your current repeat purchase rate. If it is below 25%, you are leaving money on the table. Start with a simple 3-message WhatsApp post-purchase sequence: delivery confirmation with usage tips, a check-in at day 7, and a replenishment or cross-sell offer at day 21. Get Free Growth plan 2. Quick Commerce Is No Longer Just for Groceries This is one of the most underrated shifts in Indian ecommerce right now. Quick commerce platforms like Blinkit, Zepto, and Swiggy Instamart have expanded far beyond groceries, and D2C brands are cashing in. The numbers tell the story. India’s quick commerce market is generating roughly Rs 50,000 crore in annual GMV in 2026. Blinkit alone processes 6 lakh orders daily. Non-grocery categories are now growing 1.6x faster than groceries on these platforms, and over 30% of products listed on some quick commerce platforms are from D2C brands. Here is what matters for your brand: sales through quick commerce platforms are growing at 45% year-on-year for D2C brands, and for some brands, Q-commerce now accounts for up to 87% of total sales. Brands like boAt have been early movers here. Their charging cables and earbuds are now available for 10-minute delivery across metros. For personal care brands, this is even more relevant. A customer running out of face wash at 9 PM will order from Blinkit before they will visit your Shopify store. Blinkit is expanding to 3,000 dark stores by March 2027 (up from about 1,800 currently). Swiggy Instamart has crossed 1,000 dark stores. This means the reach is only going to increase. Action step: If your product has a use-it-up cycle (personal care, food, supplements, household) or an impulse purchase component (accessories, small electronics), list on at least one Q-commerce platform this quarter. Start with Blinkit, which currently holds over 50% market share. Get Free Growth plan 3. WhatsApp Has Become the Highest-ROI Marketing Channel Email open rates in India hover around 15% to 25%. WhatsApp? 85% to 95%, with most messages read within the first 5 minutes. That alone should tell you where to invest. But open rates are just the beginning. WhatsApp cart recovery messages, sent within 15 to 30 minutes of abandonment, are recovering 15% to 25% of abandoned carts for Indian D2C brands. Compare that to email cart recovery rates of 3% to 5%. The most sophisticated D2C brands are building entire commerce flows on WhatsApp. This includes product discovery (sending curated collections based on past purchases), order tracking, post-purchase education, review collection, and reorder prompts. Customers acquired through your own site and nurtured via WhatsApp have 2x to 3x higher lifetime value than marketplace customers. Mamaearth has built a particularly effective WhatsApp strategy. They use the channel for everything from ingredient education to seasonal product bundles, turning what most brands treat as a notification channel into a genuine sales and relationship engine. Action step: Set up three WhatsApp automation flows this month: abandoned cart recovery (trigger within 15 minutes), post-purchase review request (day 5 after delivery), and replenishment reminder (based on your product’s usage cycle). Tools like CampaignHQ, Interakt, and Wati make this straightforward for Indian D2C brands. Want a done-for-you WhatsApp retention setup? Talk to our team at Aim n Launch. Get Free Growth plan 4. AI-Powered Personalization Is Not Optional Anymore Here is a stat that should make you uncomfortable if you are still showing the same homepage to every visitor: ecommerce brands using AI-driven personalization report 20% to 30% higher conversion rates and up to 25% higher Average Order Value. Companies using AI personalization earn 40% more revenue than those without it. In India specifically, 49% of online shoppers
The Perfect Product Page: 12 Elements That Separate Rs 50L/Month Shopify Stores from Rs 5L/Month Ones
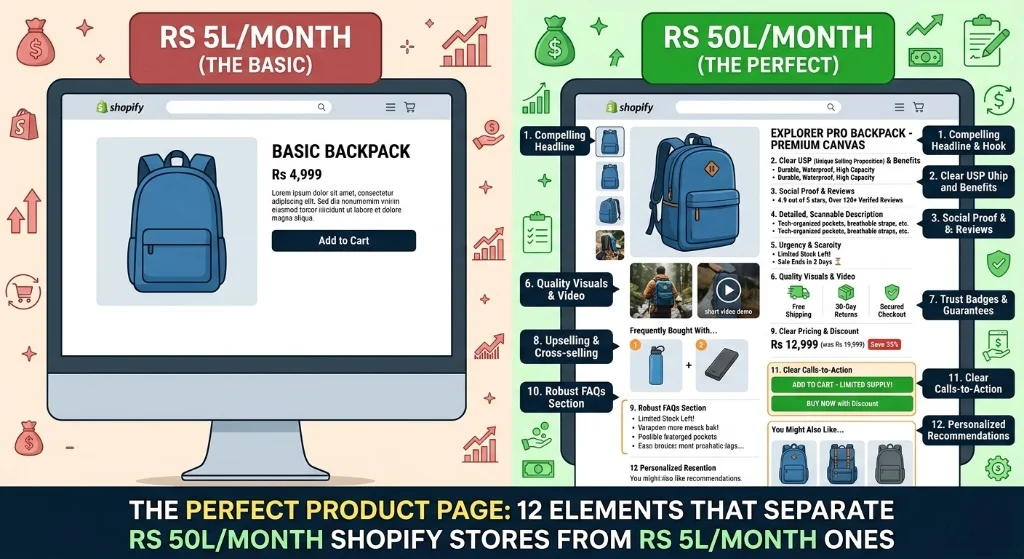
The Perfect Product Page: 12 Elements That Separate Rs 50L/Month Shopify Stores from Rs 5L/Month Ones Here is something most Indian D2C founders get wrong about ecommerce product page optimization: they spend Rs 5-10 lakh per month driving traffic through Meta and Google Ads, then send all of it to product pages that convert at a miserable 1.2%. The math is brutal. At a cost per click of Rs 15 and a 1.2% conversion rate, you are paying Rs 1,250 per purchase just in ad costs. Bump that conversion rate to 3.5%, and your cost per purchase drops to Rs 428. Same traffic. Same ad spend. Completely different unit economics. We have audited over 100 Indian D2C Shopify stores at Aim n Launch, and the pattern is consistent: stores doing Rs 50L+ per month are not necessarily spending more on ads. They are converting more of the traffic they already have. And the difference almost always starts at the product page. This post breaks down the 12 specific elements that separate high-converting product pages from the ones bleeding money. Every tactic is India-specific, tested on real Shopify stores, and backed by data. Want us to audit your product pages for free? Book a 15-minute CRO audit call and we will show you exactly where you are losing conversions. Get Free Growth plan 1. Hero Image System (Not Just “Good Photos”) The product image is the single highest-impact conversion element on any ecommerce product page. Pages with high-quality, multi-angle product photography see 30% higher conversion rates compared to single-image layouts, according to VWO’s 2026 ecommerce benchmark study. But “good photos” is vague advice. Here is what high-converting Indian D2C brands actually do. The 7-image framework that works: Image 1 is a clean, white-background hero shot. Image 2 is a lifestyle shot showing the product in use. Image 3 is a scale reference (product held in hand or next to a common object). Image 4 is an ingredients or materials close-up. Image 5 is a packaging shot (critical for gifting categories). Image 6 is a before/after or comparison shot. Image 7 is a UGC or customer photo. Real example: Minimalist, the skincare brand, uses this exact framework. Their product pages feature clinical-grade product shots alongside ingredient breakdowns and real customer before/after images. Their reported product page conversion rate sits around 4.2%, well above the 1.5-2.5% Indian D2C average. Action step: Audit your top 10 SKUs right now. If any product has fewer than 5 images, that is your first fix. Hire a product photographer for Rs 15,000-25,000 per shoot, or use a tool like Blend or Photoroom for AI-enhanced backgrounds on a budget. Get Free Growth plan 2. The Above-the-Fold Stack 93% of consumers cite visual appearance as the key deciding factor in purchase decisions. What appears on screen before a customer scrolls, your above-the-fold content, determines whether they stay or bounce. The Aim n Launch Above-the-Fold Framework: On the left side of the page, place your image carousel with zoom capability. On the right side, stack these elements in order: product title (H1, under 70 characters), star rating with review count (clickable to scroll to reviews section), price with MRP strikethrough and discount percentage, a one-line value proposition (not the full description), variant selectors for size and colour, the Add to Cart button (high contrast, full width on mobile), and a trust strip showing icons for free shipping, easy returns, and secure payment. Why this matters for India specifically: Indian shoppers are comparison shoppers. If they cannot see the price, discount, and basic trust signals without scrolling, they will bounce to Amazon or Flipkart to compare. Your above-the-fold section has to answer three questions in under 5 seconds: What is this? How much does it cost? Can I trust this store? Action step: Open your top-selling product page on a mobile phone. Screenshot only what appears before scrolling. If you cannot see the price, Add to Cart button, and at least one trust signal, you need to restructure your above-the-fold layout immediately. Get Free Growth plan 3. Benefit-Led Product Descriptions (Not Feature Dumps) Most Indian D2C brands write product descriptions like specification sheets. They list ingredients, dimensions, and technical features, then wonder why nobody reads past the first line. High-converting product descriptions follow the Problem-Agitation-Solution (PAS) framework adapted for ecommerce. Structure that converts: Start with a one-sentence hook addressing the customer’s pain point. Follow with 3-4 bullet points of benefits (not features), each starting with a verb. Then add a short paragraph with the brand story or product origin. Finally, include a collapsible section for full technical specifications. Example transformation: Bad: “100% organic cotton t-shirt. 180 GSM. Pre-shrunk. Available in 6 colours.” Good: “Sick of t-shirts that lose shape after 3 washes? Our 180 GSM organic cotton holds its fit for 50+ washes, guaranteed. Pre-shrunk so you get exactly the size you ordered. And because it is organic, your skin breathes even in Delhi’s 45-degree summers.” Real example: Snitch, the fast-fashion menswear brand doing Rs 100Cr+ annually, uses punchy, benefit-led copy on every product page. They lead with style context (“Perfect for brunch dates and weekend getaways”) before listing fabric details. Their product pages convert at rates significantly above the fashion category average of 1.5-2.5%. Action step: Rewrite descriptions for your top 5 selling products using the PAS framework. Test the new copy for 2 weeks and measure the conversion rate change. Get Free Growth plan 4. Pricing Psychology That Works in India Indian shoppers are some of the most price-sensitive online buyers in the world. The way you display pricing can swing conversion rates by 15-20%. The pricing display stack that converts: Show the selling price in large, bold font. Place the MRP with a strikethrough next to it. Show the discount percentage in a colored badge (green or red). If the discount is above 30%, add a “You save Rs X” line. For products above Rs 1,000, show EMI options (Simpl, ZestMoney, or Shopify’s native EMI). Data point:
Advantage+ Shopping Campaigns: The Complete Setup Guide for Indian Ecommerce Brands
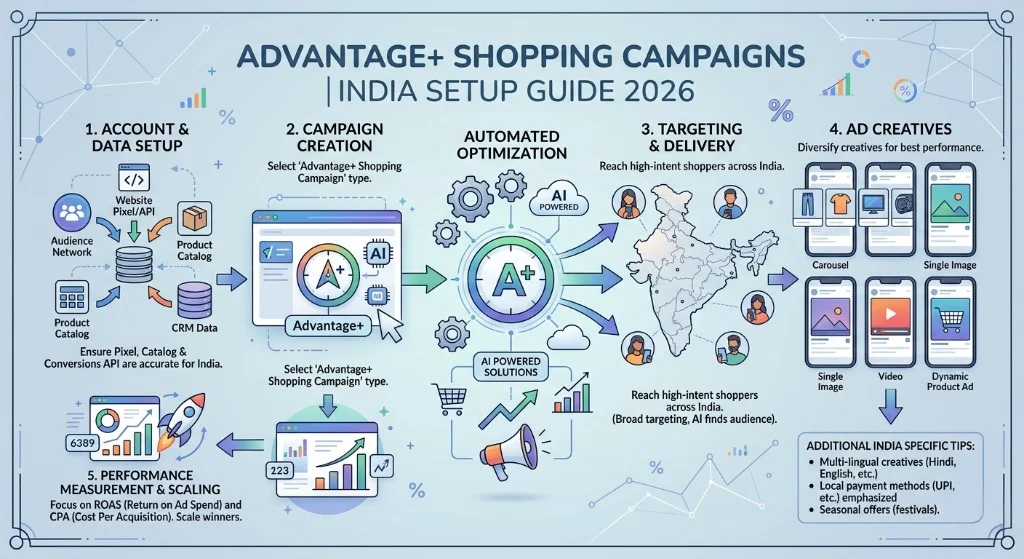
Advantage+ Shopping Campaigns: The Complete Setup Guide for Indian Ecommerce Brands If you are running Meta ads for an Indian D2C brand in 2026 and you are still relying entirely on manual campaign structures, you are leaving money on the table. That is not an opinion. Meta’s own data shows that Advantage+ Shopping Campaigns (ASC) deliver 22% higher ROAS and 17% lower cost per acquisition compared to manually managed campaigns. Across 50+ Indian ecommerce accounts we have managed at Aim n Launch, ASC has become the single most important campaign type for scaling profitably. But here is the catch. Most brands set up ASC wrong. They throw in a few creatives, set a budget, hit publish, and wonder why results are mediocre. Advantage+ is powerful, but only when you understand how the algorithm thinks, what inputs it needs, and how to structure everything for the Indian market specifically. This guide walks you through the exact setup process, budget allocation, creative strategy, and optimization playbook we use for brands spending Rs 5L to Rs 30L per month on Meta ads. No theory. Just the system that works. Want us to set this up for you? Book a free Meta ads audit and we will review your current campaign structure in 15 minutes. Get Free Growth plan What Are Advantage+ Shopping Campaigns (And Why Should You Care)? Advantage+ Shopping Campaigns, now officially called Advantage+ Sales Campaigns in Meta’s updated naming convention, are Meta’s AI-driven campaign type designed specifically for ecommerce. Unlike manual campaigns where you control every lever (audiences, placements, bidding), ASC hands most of those decisions to Meta’s machine learning algorithm. Here is what ASC automates for you: audience targeting across prospecting and retargeting, placement optimization across Facebook, Instagram, Messenger, and the Audience Network, creative testing and rotation, and bid adjustments in real time. The algorithm processes signals from your pixel data, your product catalog, user behavior patterns, and creative performance to find the highest-intent buyers at the lowest cost. Think of it as handing Meta a budget and a set of creatives, and letting the machine figure out who to show them to, where, and when. Why does this matter for Indian ecommerce specifically? India’s D2C market now has 800+ brands competing for the same audiences on Meta. CPMs have risen steadily since 2024. Manual campaigns that worked two years ago are now too expensive to scale. ASC gives the algorithm freedom to find pockets of efficiency that no human media buyer can manually identify across millions of users. As of Q1 2026, ASC now accounts for 62% of all ecommerce conversion spend on Meta globally, up from 34% in 2024. The shift is happening fast, and Indian brands that delay the migration are competing with one hand tied behind their backs. Get Free Growth plan The ASC Setup Checklist: Before You Touch Ads Manager Before you create a single campaign, you need to get your foundations right. Skipping this step is the number one reason ASC underperforms for Indian brands. Pixel and Conversion API (CAPI) Setup Your Meta pixel must be firing correctly on all key events: ViewContent, AddToCart, InitiateCheckout, and Purchase. But in 2026, pixel-only tracking is not enough. You need the Conversion API (CAPI) running server-side to capture events that browser-side tracking misses due to iOS privacy restrictions, ad blockers, and network issues. For Shopify stores, the native Meta sales channel handles CAPI automatically. For custom-built stores on WooCommerce or headless setups, you will need server-side integration through a partner like Stape or a custom implementation. Check your Events Manager. If your Event Match Quality (EMQ) score is below 6 out of 10 for Purchase events, fix this before launching ASC. Low EMQ means the algorithm is working with incomplete data and will make poor optimization decisions. Get Free Growth plan Product Catalog Optimization ASC pulls products from your Meta catalog for dynamic ads. Your catalog needs to be clean, updated, and complete. Every product should have high-quality images (minimum 1080×1080), accurate pricing in INR, correct availability status, and detailed product titles that include the category, brand, and key attributes. Brands that maintain a well-optimized catalog see 15-25% better performance in ASC compared to those running with incomplete or outdated product feeds. Custom Audience Definitions Even though ASC automates targeting, you still need to define two critical audience segments in your Advertising Settings: Existing Customers (people who have already purchased) and Engaged Audience (people who have interacted with your brand but have not purchased). Upload your customer list from Shopify, set up a Purchase custom audience from your pixel, and create engagement audiences from your Instagram and Facebook page interactions. These definitions help the algorithm distinguish between prospecting and retargeting, which directly affects how your budget gets allocated. Get Free Growth plan Step-by-Step: Setting Up Your First ASC Campaign Here is the exact process we follow at Aim n Launch when setting up ASC for a new brand. Step 1: Create the Campaign Open Ads Manager, click Create, and select “Sales” as your campaign objective. On the next screen, select “Advantage+ Shopping Campaign.” Click Continue. Name your campaign clearly. We use the format: “ASC – [Brand] – [Month] – [Objective].” For example: “ASC – Snitch – Apr 2026 – Purchase”. Step 2: Set Your Budget This is where most Indian brands go wrong. They start with Rs 500 per day and expect results. The algorithm needs enough daily budget to generate 50 optimization events per week to exit the learning phase. If your average cost per purchase is Rs 800, you need at least Rs 5,600 per day (Rs 800 x 7 purchases per day) to give the algorithm room to learn. Here is our recommended budget framework for Indian brands: Starting brands (testing ASC for the first time): Rs 3,000 to Rs 5,000 per day minimum. This translates to roughly Rs 90,000 to Rs 1,50,000 per month just for ASC. Scaling brands (proven product-market fit, good unit economics): Rs 10,000 to Rs 30,000 per
7 Battle-Tested Ways Indian D2C Brands Are Cutting CAC by 40% in 2026
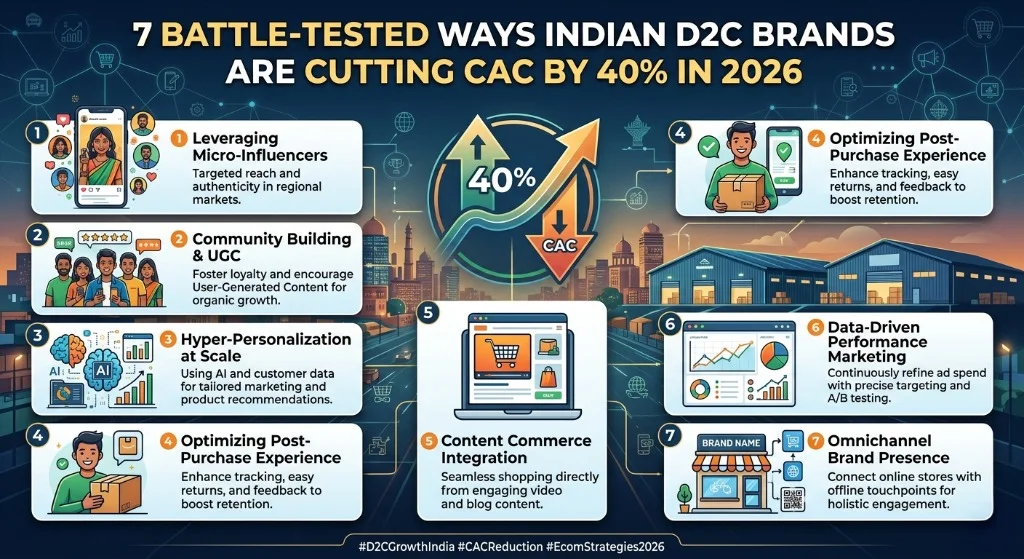
7 Battle-Tested Ways Indian D2C Brands Are Cutting CAC by 40% in 2026 If you run a D2C brand in India, you already feel it. Meta and Google auction prices have risen by roughly 45% compared to 2024. What used to cost you Rs 300 per customer now costs Rs 500 or more. And if you are in beauty or personal care, you might be staring at Rs 800 to Rs 1,200 per acquired customer. The brands that are winning right now are not the ones spending the most. They are the ones who figured out how to reduce CAC in ecommerce in India without sacrificing quality of customers. This post breaks down the exact strategies, with real numbers, real brand examples, and a framework you can implement this week. Want someone to audit your CAC and find the leaks? Book a free CAC audit with our team at Aim n Launch. Get Free Growth plan Why CAC Is Spiraling Out of Control for Indian D2C Brands Before we get into solutions, you need to understand why this is happening. It is not just “ads are expensive now.” There are structural reasons behind the CAC surge. First, hundreds of D2C brands are now bidding on the same Meta and Google ad inventory. The auction is crowded, and the platforms’ algorithms favour low-cost conversions, which often means you are acquiring bargain hunters who churn after the first discount. Second, privacy changes continue to erode tracking. iOS restrictions, cookie deprecation, and tighter consent requirements mean your targeting is less precise than it was two years ago. Less precision means more wasted spend. Third, the D2C market in India is maturing. Early adopters have already been acquired. You are now trying to convert the next wave of customers who are harder to reach, more skeptical, and need more touchpoints before buying. Here is the data that puts it in perspective. For D2C fashion brands in India, CAC benchmarks range from Rs 200 to Rs 800. For beauty, it is Rs 150 to Rs 500 at the lower end, but the actual cost for many brands has ballooned to Rs 800 to Rs 1,200 per customer. In Delhi NCR specifically, heightened advertising competition inflates CAC up to 50% above other metros. The brands cutting through this are not just optimizing ads. They are rebuilding their entire acquisition architecture. Get Free Growth plan 1. Fix Your Conversion Rate Before Spending Another Rupee on Ads This is the fastest, cheapest, and most overlooked way to reduce CAC. The math is simple: if your Shopify store converts at 1.2% and you improve it to 2.4%, your CAC drops by half. You did not spend a single extra rupee on ads. Most Indian D2C brands run conversion rates between 1% and 1.8%. The top performers sit at 3% to 3.5%. That gap is not about product quality. It is about the buying experience. What to fix first: Your product pages are where the money is made or lost. Every high-converting Indian D2C product page has these elements: a hero image showing the product in use (not just a flat lay), social proof above the fold (review count plus average rating), price with savings clearly shown (strikethrough MRP is mandatory in India), delivery estimate with pincode checker, and a sticky add-to-cart button on mobile. Minimalist, the skincare brand, improved their product page conversion by adding before-and-after images and ingredient breakdowns directly on the product page. The result was a measurable lift in add-to-cart rates without changing a single ad. Your action step: Run a CRO audit on your top 5 product pages this week. Check mobile load time (should be under 3 seconds), trust signals, and checkout friction. Grab our free CRO audit checklist here. 2. Build a UGC Creative Engine That Drops Your Cost Per Click by 50% Here is the single biggest lever for reducing paid CAC in 2026: your ad creative. Raw, unedited testimonial videos from real customers are performing 40% better than high-production studio ads. Ads with UGC get 4x higher click-through rates and 50% lower cost per click compared to polished brand creative. Why? Because people scroll past ads. They stop for content that looks like a friend talking to them. boAt rebuilt its entire performance strategy around what they call creative velocity. Instead of producing one hero video per month, they now generate 15 to 20 variations per product using different openings, captions, and CTAs. They shifted from monthly to weekly creative refresh cycles, using AI-assisted tools to generate multiple hooks from the same base video. The Aim n Launch Creative Velocity Framework: Step 1: Source 10 to 15 UGC creators per month (use platforms like Insense, Clout, or direct outreach on Instagram). Step 2: Brief each creator with three different hooks for the same product. Step 3: Edit each raw video into 3 to 4 variations with different text overlays and CTAs. Step 4: Launch all variations in a single Advantage+ campaign and let Meta’s algorithm find the winners. Step 5: Kill underperformers after Rs 500 spend. Scale winners by 20% daily. This approach gives you 40 to 60 fresh creatives per month instead of 4 to 5. More creative variations mean more chances for Meta to find low-CPM pockets in the auction. Brands we work with at Aim n Launch consistently see 30% to 40% lower CPA after implementing this system. Your action step: Brief 5 UGC creators this week with 3 hook variations each. That gives you 15 raw videos to test. Download our free creative brief template. 3. Weaponize WhatsApp as a Zero-CAC Retention Channel WhatsApp is the OS of India, and it is the most underused marketing channel in Indian D2C. With 95%+ open rates and most messages read within 5 minutes, no other channel comes close for retention and reactivation. Here is why this matters for CAC: a 5% improvement in retention rate can reduce your effective CAC by 15% to 25%, because you need fewer
How to Launch a D2C Brand in India in 2026: The Complete Playbook (From Zero to Rs 10L/Month)
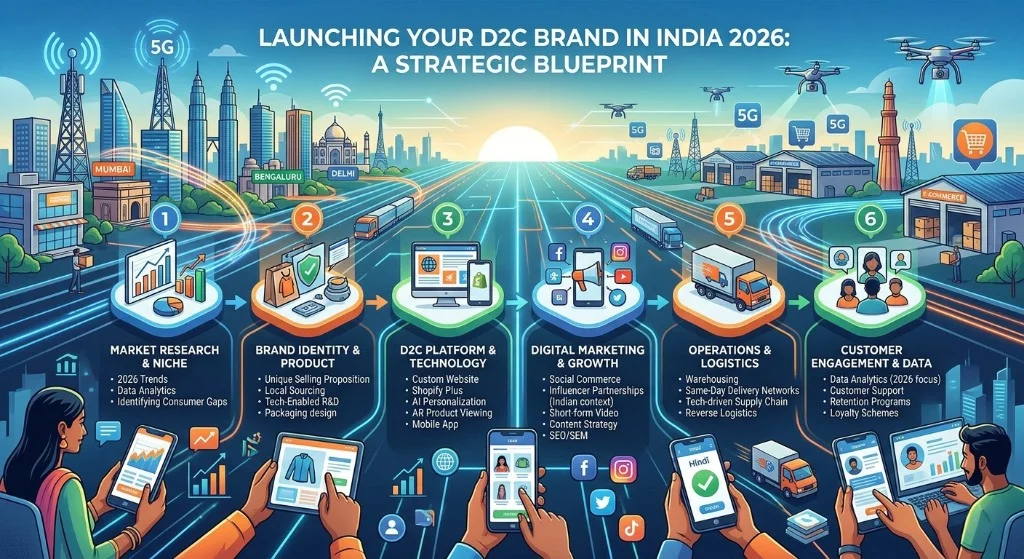
How to Launch a D2C Brand in India in 2026: The Complete Playbook (From Zero to Rs 10L/Month) India’s D2C ecommerce market hit USD 108 billion in 2026, growing at a 24.3% CAGR. Over 10,000 active D2C brands are now selling primarily through their own online channels in India. And yet, the uncomfortable truth is that most new D2C brands launched this year will not survive past month six. Not because the market is saturated. Not because Indian consumers have stopped buying online. But because most founders launch with vibes instead of a system. They pick a “trending” category, slap together a Shopify store, throw Rs 50,000 at Meta ads, and wonder why their ROAS is 0.8x by week three. This playbook is the opposite of that approach. It is the exact sequence of steps, with real budgets, timelines, and benchmarks, that we have seen work across dozens of D2C brands we have helped scale at Aim n Launch. Whether you are launching a skincare line, an apparel brand, or a packaged food product, the underlying system is the same.If you would rather have someone build this entire launch engine for you, book a free strategy call with our team and we will map out your first 90 days. Get Free Growth plan Why 2026 Is Still the Right Time to Launch a D2C Brand in India Let us address the elephant in the room. With Meta CPMs up 40% to 60% since 2023 and CAC for most categories sitting between Rs 500 and Rs 800, you might wonder if the window for new D2C brands has closed. It has not. Here is why. First, the market is massive and still underpenetrated. India’s D2C market crossed Rs 8.5 trillion in 2025, and online retail penetration is still under 10%. Compare that to China at 30% or the US at 22%. There is enormous headroom. Second, the infrastructure has caught up. UPI handles over 14 billion transactions per month. Shiprocket, Delhivery, and Xpressbees deliver to 27,000+ pin codes. Shopify’s India-specific features (INR pricing, COD support, GST compliance) make store setup faster than ever. Third, and this is the big one, the playbook has shifted. The brands winning in 2026 are not the ones spending the most on ads. They are the ones building discovery systems that combine paid acquisition with organic search, creator commerce, WhatsApp retention, and community. This means a smart founder with Rs 5 to 10 lakh can compete with brands spending 10x more, if they follow the right sequence. Get Free Growth plan The Aim n Launch D2C Launch Framework: 7 Phases Before we get into the details, here is the high-level framework. We call it the D2C Launch Ladder, and it maps the exact sequence from idea to Rs 10L/month in revenue. Phase 1: Niche Validation and Category Selection (Week 1 to 2) Phase 2: Product Development and Supply Chain Setup (Week 3 to 8) Phase 3: Brand Identity and Positioning (Week 5 to 7) Phase 4: Shopify Store Build and Optimization (Week 7 to 9) Phase 5: Pre-Launch Audience Building (Week 8 to 10) Phase 6: Paid Acquisition Engine Setup (Week 10 to 12) Phase 7: Retention and Scaling to Rs 10L/Month (Month 4 onward) Notice that ads do not even start until week 10. That is intentional. Most failed D2C brands rush to paid acquisition before their foundation is solid. The brands that reach Rs 10L/month do the boring work first. Phase 1: Niche Validation and Category Selection Most founders pick a category because it “seems hot.” That is how you end up as the 400th turmeric skincare brand competing with Mamaearth’s Rs 1,500 crore marketing budget. Instead, validate ruthlessly using this framework. The 5-Filter Validation Test Filter 1: Search Demand. Use Google Keyword Planner to check if your core product keyword gets at least 5,000 monthly searches in India. If nobody is searching for it, you will spend a fortune educating the market. Filter 2: Competition Gap. Search your target keyword on Google and Amazon. If the top 10 results are all well-funded brands with 10,000+ reviews, you need a sharper niche. Look for categories where the top brands have weak product pages, poor reviews, or generic branding. Filter 3: Margin Math. Your product must support a minimum 60% gross margin after COGS, packaging, and shipping. Below that, profitability becomes nearly impossible once you factor in CAC, returns, and COD charges. For reference, most successful Indian D2C brands operate at 65% to 75% gross margins. Filter 4: Repeat Purchase Potential. One-time purchase products (like furniture or luggage) require you to acquire a new customer for every sale. Consumables (skincare, supplements, food) give you a shot at 3x to 5x LTV multipliers. The best D2C categories in India right now for repeat purchase potential are personal care, health supplements, pet food, baby care, and premium snacks. Filter 5: Content Moat. Can you create 100+ pieces of content around this category? If yes, you can build organic acquisition channels that reduce your dependence on paid ads over time. If the category is boring to talk about, your content and creator strategy will suffer. A category that passes all five filters is worth pursuing. Three out of five is risky. Below that, go back to brainstorming. Action step: Run your top three product ideas through this 5-filter test. Score each out of 5. Only proceed with a category that scores 4 or above. Phase 2: Product Development and Supply Chain Setup This is where most first-time founders either overspend or cut corners. Both are mistakes. Here is the budget-conscious approach that works. Finding the Right Manufacturer For most categories in India, you do not need to build your own manufacturing facility. Contract manufacturing is the standard for new D2C brands. Here is where to find manufacturers by category. For beauty and personal care, look at clusters in Baddi (Himachal Pradesh), Haridwar (Uttarakhand), and Silvassa (Dadra and Nagar Haveli). These hubs offer FSSAI and GMP-certified facilities with
Shopify Conversion Rate Optimization: 15 Proven Tactics That Took Indian D2C Brands from 1% to 3.5%
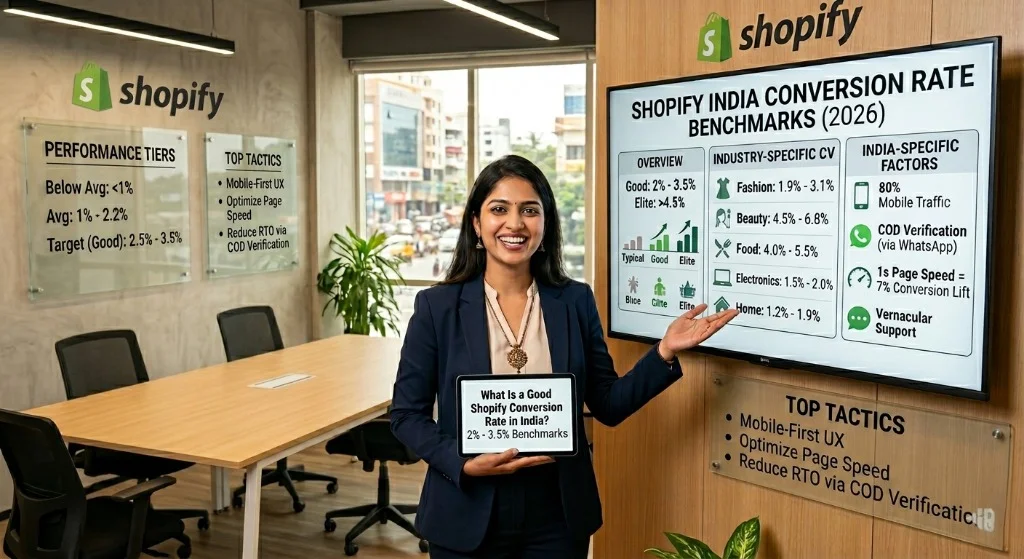
Shopify Conversion Rate Optimization: 15 Proven Tactics That Took Indian D2C Brands from 1% to 3.5% Here is a number that should keep every D2C founder up at night: the average Shopify store in India converts at roughly 1.2% to 1.5%. That means for every 1,000 visitors your Meta Ads send to your site, only 12 to 15 actually buy something. Meanwhile, the top 20% of Shopify stores globally convert at 3.2% or higher, and the top 10% sit above 4.7%. The gap between 1.2% and 3.5% does not sound massive. But do the math. If you are spending Rs 5L/month on ads and getting 50,000 visitors, the difference between a 1.2% and 3.5% conversion rate is the difference between 600 orders and 1,750 orders. Same ad spend. Same traffic. Just a better store. This guide covers 15 Shopify conversion rate optimization tactics specifically tested and proven on Indian D2C stores. Not generic advice from US-focused blogs. Every tactic here accounts for the realities of selling in India: mobile-first traffic, COD dependency, price sensitivity, UPI adoption, and Tier 2/3 city buyers on variable network speeds. Want us to audit your Shopify store for free? Book a CRO audit call with Aim n Launch and we will identify the exact leaks killing your conversion rate. Get Free Growth plan What Is a Good Shopify Conversion Rate in India? Before you start optimizing, you need to know where you stand. Here are the benchmarks we have seen across 50+ Indian D2C stores we have worked with and audited: Below 1%: Your store has fundamental problems. Likely a combination of slow load times, poor product pages, and a broken mobile experience. 1% to 1.8%: Average for Indian D2C Shopify stores. You are leaving money on the table, but the foundation exists. 1.8% to 2.5%: Above average. You have done some optimization work, but there are still significant gains available. 2.5% to 3.5%: Strong. You are in the top 20-25% of Indian D2C stores on Shopify. Above 3.5%: Exceptional. You are running a tight ship and likely have a structured CRO process in place. These benchmarks vary by category. Beauty and personal care brands in India tend to convert higher (2% to 3%) because of lower price points and repeat purchase behavior. Fashion sits lower (1% to 2%) because of sizing concerns and higher return anxiety. Food and beverage brands often see the highest rates (2.5% to 4%) because of lower consideration periods. Get Free Growth plan The Aim n Launch CRO Audit Framework Before diving into individual tactics, here is the framework we use internally to prioritize CRO work for our clients. We call it the SPTC framework: Speed: Is the store fast enough on a 4G connection in a Tier 2 city? Product Pages: Do the pages answer every objection and build enough trust to click “Add to Cart”? Trust Signals: Does the store look credible enough for a first-time visitor to hand over their money? Checkout: Is the path from cart to payment confirmation as short and frictionless as possible? Every tactic below maps back to one of these four pillars. Let us get into it. Tactic 1: Cut Your Page Load Time Below 3 Seconds on Mobile This is not optional. It is the foundation everything else sits on. Data from Google shows that a 1-second delay in mobile page load time reduces conversions by 7%. For an Indian D2C store getting 80% mobile traffic (which is the norm), a 5-second load time versus a 2-second load time could mean 20% fewer conversions, and that is before visitors even see your product page. Here is what to do: Compress all images to WebP format using apps like TinyIMG or Crush.pics. Remove unused Shopify apps (every app adds JavaScript that slows your store). Switch to a lightweight, fast theme like Dawn or Prestige. Enable lazy loading for images below the fold. Minimize custom code injections and third-party tracking pixels. Real example: One fashion D2C brand we worked with had 14 Shopify apps installed, 9 of which were not being used. Removing the unused apps dropped their mobile load time from 6.2 seconds to 2.8 seconds. Conversion rate jumped from 1.1% to 1.6% within two weeks, with zero other changes. Action step: Run your store through Google PageSpeed Insights right now. If your mobile score is below 50, speed optimization should be your number one priority before anything else on this list. Tactic 2: Make Your Mobile Product Page Scroll-Proof Over 80% of your Indian D2C traffic is on mobile. Your product page needs to work flawlessly on a 6-inch screen. The biggest mistake we see: the “Add to Cart” button disappears as the visitor scrolls down to read product details, reviews, or size charts. By the time they scroll back up, the buying impulse is gone. Implement a sticky “Add to Cart” bar that stays visible at the bottom of the screen as visitors scroll. This single change has consistently delivered a 5-12% lift in add-to-cart rates across stores we have optimized. Also ensure your product images are swipeable (not tap-to-zoom), your variant selectors are large enough for thumbs (not tiny dropdowns), and your product description sections are collapsible accordions so visitors can find what they need without endless scrolling. Action step: Open your store on your phone right now. Try to buy a product. Count how many thumb movements it takes from landing on the product page to completing checkout. If it is more than 8, you are losing conversions. Tactic 3: Display COD Availability Above the Fold Cash on Delivery still accounts for 40-60% of orders for most Indian D2C brands, especially those selling to Tier 2 and Tier 3 cities. If a visitor cannot immediately see that COD is available, many will bounce before even considering a purchase. Do not bury this information in your FAQ or shipping policy page. Show “Cash on Delivery Available” right next to your price, above the fold, on every product page.
Meta Ads ROAS Benchmarks for Indian D2C Brands in 2026 (Data from 50+ Campaigns)
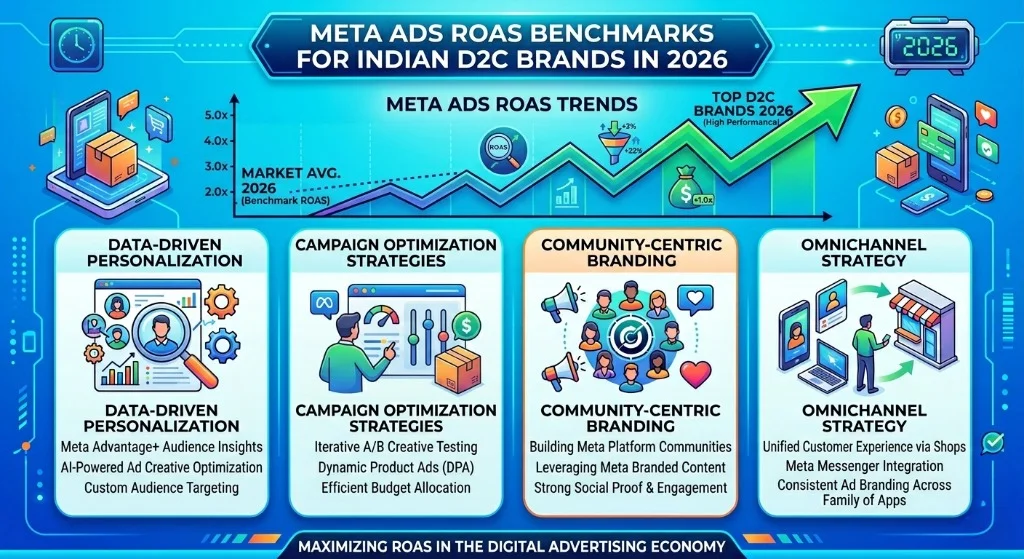
Meta Ads ROAS Benchmarks for Indian D2C Brands in 2026 (Data from 50+ Campaigns) If you are running Meta ads for your D2C brand in India right now, you have probably asked yourself this question at least once this month: “Is my ROAS actually good, or am I just burning cash?” It is a fair question. The problem is that most ROAS benchmarks floating around the internet come from US and European markets where CPMs are 8 to 10 times higher, AOVs are in dollars, and the competitive landscape looks nothing like India’s. Applying those numbers to your Rs 1,200 AOV skincare brand selling through COD in tier-2 cities is, to put it mildly, useless. We manage Meta ad spend across 50+ Indian D2C brands at Aim n Launch, ranging from Rs 5L to Rs 50L per month in ad spend. This post shares the actual ROAS benchmarks we are seeing in 2026, broken down by category, campaign type, and funnel stage, so you can finally stop guessing and start measuring against numbers that actually matter. Want us to audit your Meta ads performance against these benchmarks? Book a free ROAS audit with our team. Get Free Growth plan Why Most ROAS Benchmarks Are Misleading for Indian D2C Brands Before we get into the numbers, let us address the elephant in the room. The global average ROAS for Meta ads sits around 2.19x across all industries, according to 2025-2026 aggregate data. That number is essentially meaningless for an Indian ecommerce brand. Here is why. India is a Tier 3 market for Meta’s ad auction, which means your CPMs are significantly lower than Western markets. The average CPM in India ranges from Rs 50 to Rs 200 for feed placements, compared to roughly Rs 1,900 (approximately $23) in the United States. Lower CPMs mean you get more impressions and clicks per rupee, which inflates your ROAS relative to global benchmarks. But there is a catch. Indian D2C brands also deal with lower AOVs (typically Rs 800 to Rs 2,000 compared to $50 to $150 in the US), higher RTO rates (15 to 25% for COD orders), and thinner margins after accounting for logistics, packaging, and marketplace commissions. So a 3x ROAS in India does not mean the same thing as a 3x ROAS in the US. The only benchmarks that matter are ones from brands operating in the same market, with similar AOVs, selling through similar channels. That is what we are sharing here. Action step: Stop comparing your ROAS to global benchmarks. Build a custom benchmark sheet using your own category, AOV range, and prepaid vs COD mix. Get Free Growth plan Category-Wise ROAS Benchmarks for Indian D2C Brands in 2026 Based on data from our portfolio of 50+ active campaigns, here are the ROAS benchmarks by category for Indian D2C brands running Meta ads in 2026. These are blended ROAS numbers (combining prospecting and retargeting) measured on a 7-day click, 1-day view attribution window. CM1 (Contribution Margin 1): Your Product-Level Profit Beauty and Personal Care Average blended ROAS: 3.5x to 5x This is the strongest performing category on Meta in India right now. Beauty brands benefit from highly visual products, strong impulse-buy behavior, and relatively high repeat purchase rates. Brands like Minimalist and Pilgrim have built massive scale on Meta by combining UGC-style creator content with aggressive offer testing. Top performers in this category are hitting 5x to 6x blended ROAS, but they are also running 60 to 70% prepaid orders, which dramatically improves their effective ROAS after accounting for RTOs. Key driver: Product education content. Short videos explaining ingredients, showing before-after results, and creator testimonials consistently outperform polished brand films. Fashion and Apparel Average blended ROAS: 2.5x to 4x Fashion is trickier because of higher return rates and the fact that sizing concerns reduce impulse purchases. Brands like Snitch and Bewakoof have found their sweet spot by focusing on low-price-point impulse buys (Rs 500 to Rs 1,500) with strong visual hooks. The ROAS range here is wide. Brands selling basics and everyday wear at low AOVs can hit 4x consistently. Premium fashion brands with Rs 2,500+ AOVs often struggle to cross 2.5x because the consideration period is longer and Meta’s algorithm optimizes better for high-volume, low-friction purchases. Key driver: Carousel ads showcasing multiple products and lifestyle imagery. Video ads showing “outfit of the day” content from real customers outperform studio lookbooks by 30 to 40%. Food and Beverages Average blended ROAS: 2x to 3x Food brands face a unique challenge on Meta: the product is perishable, shipping is expensive relative to the product cost, and AOVs tend to be low (Rs 400 to Rs 800). Brands in this space need to think in terms of customer lifetime value rather than first-purchase ROAS. The best performers here, like brands in the health snacks and protein supplements space, push AOV up through bundles and subscriptions. A brand selling individual Rs 300 protein bars will struggle on Meta. The same brand selling a Rs 1,500 monthly subscription box can make the math work. Key driver: Subscription and bundle offers. Brands that successfully push bundle AOVs above Rs 1,200 see their ROAS jump from the 1.5x to 2x range into the 2.5x to 3.5x range. Health and Wellness Average blended ROAS: 3x to 4.5x This category has seen massive growth on Meta in India, particularly for ayurvedic and natural wellness products. The trust factor is critical here, which is why creator-led content featuring health practitioners and real user testimonials drives the best performance. Brands in the supplements, immunity, and sexual wellness space are seeing strong ROAS because these products have high perceived value, decent margins, and strong repeat purchase behavior. Key driver: Long-form UGC content (60 to 90 seconds) where creators explain the problem, share their experience, and show results. This format consistently delivers 20 to 30% lower cost per purchase compared to short, snappy ads. Action step: Find your category benchmark from the list above. If your blended ROAS is
CM2 for Ecommerce: The Only Profitability Metric D2C Founders in India Should Track
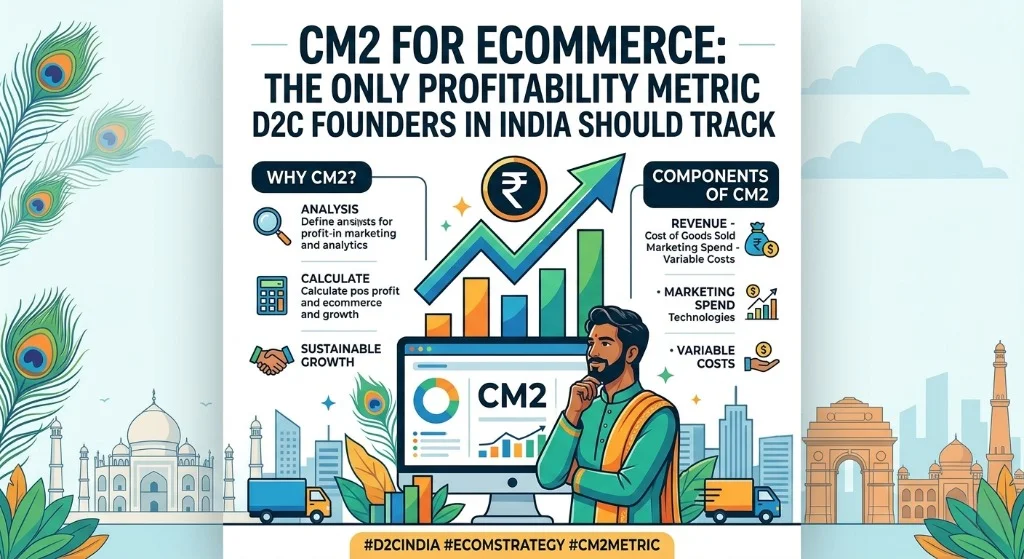
CM2 for Ecommerce: The Only Profitability Metric D2C Founders in India Should Track Here is a number that should terrify every D2C founder in India: 68% of Indian D2C brands with negative unit economics are expected to shut down by 2026. Not because they lacked product-market fit. Not because they ran out of ideas. Because they never figured out how much money they actually made (or lost) on every order. The metric that separates the brands scaling to Rs 1Cr/month from the ones bleeding cash? CM2, or Contribution Margin 2. If you are running a D2C brand in India, spending Rs 5L or more per month on Meta and Google Ads, and you cannot tell me your CM2 per order within 10 seconds, you have a problem. A big one. This guide breaks down exactly what CM2 is, how to calculate it with Indian cost structures (COGS, shipping, COD charges, payment gateway fees, RTO losses, ad spend), and what benchmarks you should aim for in 2026. We will walk through real examples, give you a framework to find your profit leaks, and share the exact template we use with our clients at Aim n Launch. Want us to calculate your CM2 for you? Book a free unit economics audit and we will map your entire order-level profitability in 30 minutes. Get Free Growth plan Why Revenue and Gross Margin Are Lying to You Most Indian D2C founders track two numbers religiously: revenue and gross margin. “We did Rs 40L this month.” “Our gross margins are 65%.” Sounds great on paper. But here is what gross margin does not account for: The Rs 80 you paid Shiprocket per order. The 2% payment gateway fee on every transaction. The Rs 150 you spent on Meta Ads to acquire that customer. The Rs 120 you lost when 25% of your COD orders got returned. The Rs 15 packaging cost per unit. When you subtract all of these from your “65% gross margin,” many brands discover they are making Rs 30 to Rs 50 per order. Some discover they are losing money on every single sale. Gross margin tells you how much your product costs to make. CM2 tells you how much your business actually earns per order after everything it takes to sell and deliver that product. That is the difference between a vanity metric and a survival metric. Get Free Growth plan Understanding CM1, CM2, and CM3: The Profitability Stack Before we dive deep into CM2, let us understand the full contribution margin stack. Think of it as peeling layers off an onion, where each layer reveals more about where your money actually goes. CM1 (Contribution Margin 1): Your Product-Level Profit Formula: CM1 = Net Revenue – COGS – Packaging – Shipping – Payment Gateway Fees – Returns/RTO Costs CM1 answers one question: “After making, packing, shipping, and processing the payment for this order, how much is left?” For an Indian D2C brand, CM1 typically includes: Cost of goods sold (raw materials, manufacturing) Packaging materials (boxes, fillers, branded inserts) Shipping and logistics (Shiprocket, Delhivery, BlueDart rates) Payment gateway fees (Razorpay at 2%, or COD charges at Rs 30-60 per order) Returns and RTO costs (reverse logistics, damaged goods, restocking) Benchmark: Healthy Indian D2C brands aim for CM1 of 40-55% of net revenue, depending on category. CM2 (Contribution Margin 2): Your True Order-Level Profit Formula: CM2 = CM1 – Marketing Spend (allocated per order) CM2 answers the critical question: “After I account for the cost of acquiring this customer, did this order actually make money?” This is where most Indian D2C brands get a rude awakening. You take your CM1, subtract the marketing cost per order (total ad spend divided by total orders), and suddenly that “profitable” brand is underwater. Benchmark: Best-in-class Indian D2C brands maintain CM2 of 15-25% of net revenue. If your CM2 is negative, you are literally paying customers to buy from you. CM3 (Contribution Margin 3): Your Business-Level Profit Formula: CM3 = CM2 – Fixed Overheads (team salaries, rent, software, subscriptions) CM3 tells you if the business as a whole is viable. But CM3 is a business-level metric. CM2 is the order-level metric that determines whether scaling will make you richer or broker. This is why CM2 matters most: If your CM2 is positive, scaling makes sense because every additional order adds profit. If your CM2 is negative, scaling just means you lose money faster. No amount of “we’ll make it up on volume” fixes a negative CM2. Get Free Growth plan How to Calculate CM2 for Your Indian D2C Brand: Step-by-Step Let us walk through this with a realistic example. Say you sell premium skincare products through your Shopify store. Step 1: Calculate Net Revenue Per Order Start with what you actually receive, not the MRP. Line Item Amount Average Order Value (MRP) Rs 1,200 Discount (15% average) – Rs 180 GST (12%) – Rs 109 Net Revenue Rs 911 Most founders make the mistake of using their AOV as the starting point. Your net revenue after discounts and GST is what matters. Step 2: Calculate COGS Per Order Line Item Amount Product manufacturing cost Rs 180 Packaging (box, fillers, inserts) Rs 45 Total COGS Rs 225 Most founders make the mistake of using their AOV as the starting point. Your net revenue after discounts and GST is what matters. Step 3: Calculate Fulfillment Costs Per Order This is where India-specific costs hit hard. Line Item Amount Product manufacturing cost Rs 180 Packaging (box, fillers, inserts) Rs 45 Total COGS Rs 225 A few notes on these numbers. The blended shipping rate assumes you are using a 3PL aggregator like Shiprocket or Pickrr. The COD split of 35% is realistic for a brand actively pushing prepaid (industry average is 30-50%). The 8% RTO rate is optimistic. Many Indian D2C brands see 15-25%, especially in Tier 2 and Tier 3 cities. If your RTO rate is above 15%, this single line item can destroy your entire unit
Meta Ads ROAS Benchmarks for Indian D2C Brands in 2026 (Data from 50+ Campaigns)
Meta Ads ROAS Benchmarks for Indian D2C Brands in 2026 If you are running a D2C brand in India and spending Rs 5 lakh or more per month on Meta ads, you have probably asked yourself one of these questions at least once this quarter: “Is my ROAS good enough?” or “What are other brands in my category actually getting?” The answer is not a single number. It depends on your category, your margins, your creative strategy, and whether you have moved beyond the manual campaign setups that stopped working in 2024. We manage Meta ad spends across 50+ Indian D2C brands at Aim n Launch, covering beauty, fashion, food, health, and home categories. This post shares the actual ROAS benchmarks we are seeing in 2026, broken down by category, along with the strategies that separate 2x brands from 4x brands. Want us to audit your Meta ads and tell you exactly where your ROAS leaks are? Book a free ROAS audit here. Get Free Growth plan Why 2026 Is a Different Game for Meta Ads in India Before we get into the numbers, you need to understand why benchmarks from 2024 or even early 2025 are no longer reliable. Three structural shifts have changed the Meta ads landscape in India: CPM inflation is real and accelerating. The average CPM for D2C brands in India hit Rs 850 in 2025, up 22% year-on-year. Since 2023, CPMs have risen 40% to 60% across most ecommerce categories. More advertisers, more competition for the same eyeballs, higher floor prices. If your creative and targeting have not evolved, you are paying 2023 prices for 2026 impressions. Algorithm-driven targeting has replaced manual audiences. As of 2026, roughly 90% of Meta’s targeting is algorithm-driven. The platform’s machine learning decides who sees your ads, not your interest stacks or lookalike audiences. This means your job has shifted from “finding the right audience” to “feeding the algorithm the right creative signals.” Advantage+ Shopping Campaigns (ASC) are now the default. Meta’s own data shows ASC outperforms manual campaigns by 17% to 32% on cost per purchase for ecommerce brands. If you are still running traditional conversion campaigns with manually stacked audiences, you are almost certainly overpaying for results. These shifts mean that the ROAS your brand achieved 12 months ago is not a useful baseline. The brands hitting 3x to 4x ROAS today are doing fundamentally different things than the brands stuck at 1.5x to 2x. Get Free Growth plan Category-Wise ROAS Benchmarks for Indian D2C Brands Here is what we are seeing across our portfolio of 50+ campaigns in Q1 2026. These are blended ROAS numbers (combining prospecting and retargeting) measured on a 7-day click, 1-day view attribution window. Beauty and Personal Care Beauty remains one of the strongest categories on Meta in India. Average ROAS across our beauty clients sits at 3.0x to 3.5x for blended campaigns. Cold audience prospecting typically delivers 2.5x to 3.5x, while retargeting campaigns hit 6x to 10x. Skincare serums and treatments land in the 2.5x to 3.5x range. Fragrances consistently outperform at 4x to 5x. Haircare is the toughest sub-category, averaging 1.8x to 2.5x due to lower AOVs and repeat purchase cycles. Brands like Minimalist and Pilgrim have set the template here. They combine ingredient-education content (which builds trust and reduces the consideration cycle) with aggressive UGC-first creative strategies on Reels and Stories.Key benchmark: If your beauty brand is below 2.5x blended ROAS on Meta in India, your creative strategy or product page conversion rate needs immediate attention. Fashion and Apparel Fashion is a volume game with tighter margins, and the benchmarks reflect that. Average blended ROAS ranges from 2.5x to 3.5x. Fast fashion and impulse-purchase items (under Rs 1,500 AOV) tend to hit 3x to 4x due to quicker purchase decisions. Premium fashion (Rs 2,500+ AOV) averages 2x to 2.8x with longer consideration windows. Athleisure and activewear brands like Snitch have pushed into the 3.5x range by combining trend-driven creative with rapid inventory turnover. The critical variable in fashion is creative velocity. Brands refreshing creatives weekly outperform those on monthly cycles by 25% to 40% on cost per purchase.Key benchmark: Below 2.5x blended ROAS for fashion means either your AOV is too low to support paid acquisition, or your creative is fatiguing faster than you are replacing it. Food and Beverage F&B is the hardest category to make work on Meta in India, and the data confirms it. Average blended ROAS sits at 1.5x to 2.5x. Subscription-based models (like protein supplements or health foods) do better at 2x to 3x because of higher LTV. Single-purchase, low-ticket items (snacks, beverages under Rs 500) often struggle to cross 1.5x. The challenge is structural: low ticket prices, high shipping costs relative to product value, and perishability constraints. The brands winning here, like Slurrp Farm and Yoga Bar, combine Meta ads with aggressive subscription pushes and bundle offers that lift AOV above Rs 800. Key benchmark: If your F&B brand is hitting 2x+ blended ROAS on Meta, you are outperforming the category. The real lever is LTV, not first-purchase ROAS. Health and Wellness This is the most expensive category for CPMs in India, with a 38% increase in CPM inflation in 2025 alone. Average blended ROAS ranges from 2x to 3x. Nutraceuticals and supplements average 2.5x to 3.5x when backed by strong clinical claims and influencer validation. Fitness equipment and home wellness products tend to be lower at 1.8x to 2.5x. Ayurvedic and natural wellness brands that combine D2C with marketplace presence often report higher blended ROAS because Meta drives consideration while Amazon or Flipkart captures the conversion. Brands like Kapiva have cracked this by layering educational content (ingredient deep-dives, doctor testimonials) into their ad funnels, which reduces CPA by building trust before the purchase decision. Key benchmark: Health brands spending below Rs 10L/month often underperform because they cannot generate the 50 optimization events per week Meta needs to exit the learning phase. Home and Lifestyle Home decor, furnishing, and lifestyle brands occupy an
CM2 for Ecommerce: The Only Profitability Metric D2C Founders in India Should Track
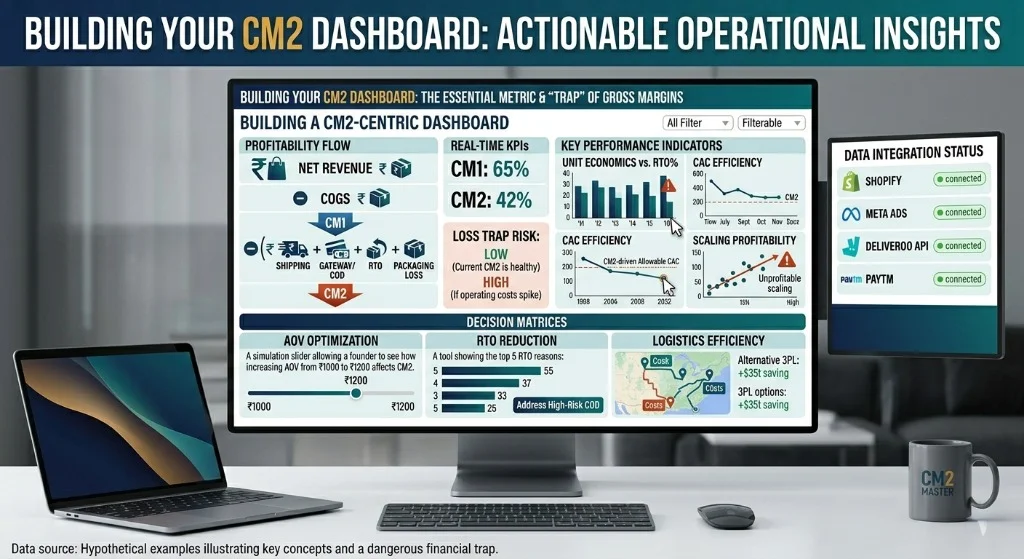
CM2 for Ecommerce: The Only Profitability Metric D2C Founders in India Should Track Here is a number that should keep every D2C founder in India up at night: 73% of ecommerce brands that crossed Rs 1 crore in annual revenue in 2024 were still not profitable at the unit level. They had revenue. They had growth. They had impressive GMV numbers. What they did not have was a clear picture of whether every order they shipped actually made them money. The reason? Most Indian D2C founders track ROAS, revenue, and maybe gross margin. Almost none track CM2, which is the single metric that tells you whether your business model is actually viable or just a cash-burning machine with good marketing. In this guide, we will break down exactly what CM2 is, how to calculate it with real INR numbers, what good CM2 looks like across Indian D2C categories, and the specific levers you can pull to improve it. We are also including a free calculator template at the end. Want us to run a CM2 analysis on your brand? Book a free 15-minute audit call with Aim n Launch. Get Free Growth plan What Is CM2 and Why Should You Care? CM2 stands for Contribution Margin 2. It is the profit left over from an order after you subtract product cost, packaging, shipping, payment gateway fees, returns, AND customer acquisition cost. Here is the formula: CM2 = Revenue per Order – COGS – Packaging – Shipping – Payment Gateway Fee – Return Cost Allocation – Customer Acquisition Cost (CAC) The critical difference between CM2 and gross margin is that CM2 includes your ad spend. Gross margin tells you “is the product itself profitable.” CM2 tells you “is the business of selling this product to a customer you acquired through ads profitable.” This matters because in Indian D2C, ad spend is typically your single largest variable cost. For most brands spending Rs 5-20L/month on Meta and Google, ad spend represents 25-40% of revenue. If you are not factoring that into your per-order profitability calculation, you are flying blind. Get Free Growth plan The Dangerous Trap: Positive Gross Margin, Negative CM2 Consider this real scenario from a beauty brand we audited in Delhi (numbers anonymized): Average Order Value (AOV): Rs 899 COGS: Rs 180 (20% of AOV) Gross Margin: Rs 719 (80%) Looks great, right? 80% gross margin. Now let us add the real costs: Packaging: Rs 45 Shipping (blended, including RTO): Rs 95 Payment gateway (2%): Rs 18 Return cost allocation (15% RTO rate): Rs 85 CAC (from Meta ads): Rs 550 CM2 = Rs 899 – 180 – 45 – 95 – 18 – 85 – 550 = negative Rs 74 This brand was losing Rs 74 on every single order they acquired through paid ads, despite having an “80% gross margin.” They had been running this way for 14 months, burning through their seed funding, celebrating revenue growth while bleeding cash on every transaction. Get Free Growth plan How to Calculate CM2: Step-by-Step With INR Numbers Let us walk through each component with realistic Indian D2C numbers. Step 1: Start With Your Actual AOV Do not use your catalogue price. Use your real blended AOV after discounts, coupons, and bundling. For Indian D2C, typical AOVs by category: Beauty/skincare: Rs 600-1,200 Fashion/apparel: Rs 1,200-2,500 Food/supplements: Rs 400-800 Home decor: Rs 1,500-3,500 Pet care: Rs 700-1,200 Step 2: Subtract COGS (Cost of Goods Sold) This includes raw materials, manufacturing, and any direct production costs. Indian D2C COGS benchmarks: Beauty/personal care: 15-25% of MRP Fashion/apparel: 30-45% of MRP Food/FMCG: 35-50% of MRP Electronics/gadgets: 40-55% of MRP Important: Calculate COGS against your actual selling price (after discount), not MRP. If your MRP is Rs 999, your COGS is Rs 200, but you sell at Rs 699 after a 30% discount, your COGS percentage jumps from 20% to 28.6%. Step 3: Subtract Packaging Cost Indian D2C packaging costs typically range from Rs 25 to Rs 80 per order depending on product category and brand positioning. Premium unboxing experiences (custom boxes, tissue paper, thank-you cards) can push this to Rs 100-150. Include the cost of any inserts, samples, or promotional materials you add to each shipment. Step 4: Subtract Shipping Cost (Blended) This is where most Indian founders underestimate. Your blended shipping cost must account for: Forward shipping: Rs 50-80 for most courier partners in India COD remittance fee: Rs 25-40 (if you offer COD) RTO shipping (return to origin): Rs 80-120 for failed deliveries Reverse shipping (customer-initiated returns): Rs 60-90 The blended formula: (Forward cost x orders) + (RTO cost x RTO orders) + (Reverse cost x return orders), divided by total successful orders. For a brand with 25% COD, 12% RTO rate, and 8% return rate, the blended shipping cost per delivered order is typically Rs 85-110. Step 5: Subtract Payment Gateway Fees Standard rates in India: Razorpay/Cashfree/PayU: 1.8-2.2% per transaction COD handling fee: Rs 25-40 per order (often charged by logistics partner) UPI: 0% merchant fee (but some aggregators charge Rs 2-5) Blended payment cost for a brand with 30% COD and 70% prepaid: approximately 2.5-3% of AOV. Step 6: Allocate Return/RTO Costs This is the cost that Indian D2C brands consistently underestimate. India has one of the highest RTO rates in ecommerce globally: Fashion/apparel: 15-25% RTO + returns Beauty: 8-12% Food/supplements: 5-8% Electronics: 10-15% For every order that gets returned, you lose: forward shipping + return shipping + repackaging labor + potential product damage. Allocate this cost across your successful orders. Step 7: Subtract CAC (Customer Acquisition Cost) This is the big one. CAC = Total ad spend / Number of new customers acquired. 2026 Meta Ads CAC benchmarks for Indian D2C (based on industry data): Beauty/personal care: Rs 350-600 Fashion/apparel: Rs 400-800 Food/supplements: Rs 200-450 Health/wellness: Rs 500-900 Home/lifestyle: Rs 600-1,200 Important nuance: Separate your new customer CAC from repeat customer CAC. If 30% of your orders come from repeat customers (acquired through email/SMS, not ads), your blended CAC