If you are running Meta ads for your D2C brand in India right now, you have probably asked yourself this question at least once this month: “Is my ROAS actually good, or am I just burning cash?”
It is a fair question. The problem is that most ROAS benchmarks floating around the internet come from US and European markets where CPMs are 8 to 10 times higher, AOVs are in dollars, and the competitive landscape looks nothing like India’s. Applying those numbers to your Rs 1,200 AOV skincare brand selling through COD in tier-2 cities is, to put it mildly, useless.
We manage Meta ad spend across 50+ Indian D2C brands at Aim n Launch, ranging from Rs 5L to Rs 50L per month in ad spend. This post shares the actual ROAS benchmarks we are seeing in 2026, broken down by category, campaign type, and funnel stage, so you can finally stop guessing and start measuring against numbers that actually matter.
Want us to audit your Meta ads performance against these benchmarks? Book a free ROAS audit with our team.
Before we get into the numbers, let us address the elephant in the room. The global average ROAS for Meta ads sits around 2.19x across all industries, according to 2025-2026 aggregate data. That number is essentially meaningless for an Indian ecommerce brand.
Here is why. India is a Tier 3 market for Meta’s ad auction, which means your CPMs are significantly lower than Western markets. The average CPM in India ranges from Rs 50 to Rs 200 for feed placements, compared to roughly Rs 1,900 (approximately $23) in the United States. Lower CPMs mean you get more impressions and clicks per rupee, which inflates your ROAS relative to global benchmarks.
But there is a catch. Indian D2C brands also deal with lower AOVs (typically Rs 800 to Rs 2,000 compared to $50 to $150 in the US), higher RTO rates (15 to 25% for COD orders), and thinner margins after accounting for logistics, packaging, and marketplace commissions. So a 3x ROAS in India does not mean the same thing as a 3x ROAS in the US.
The only benchmarks that matter are ones from brands operating in the same market, with similar AOVs, selling through similar channels. That is what we are sharing here.
Action step: Stop comparing your ROAS to global benchmarks. Build a custom benchmark sheet using your own category, AOV range, and prepaid vs COD mix.
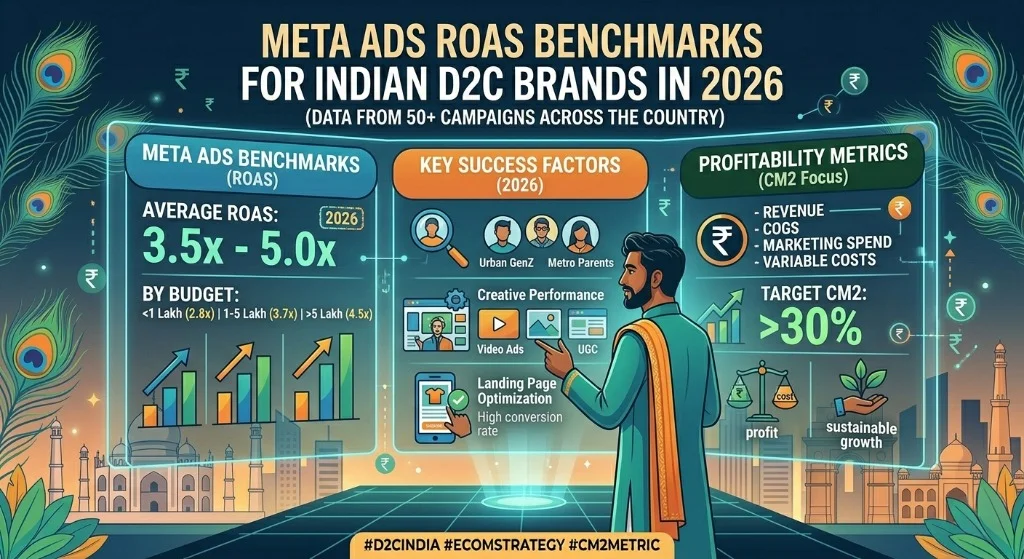
Based on data from our portfolio of 50+ active campaigns, here are the ROAS benchmarks by category for Indian D2C brands running Meta ads in 2026. These are blended ROAS numbers (combining prospecting and retargeting) measured on a 7-day click, 1-day view attribution window.
Average blended ROAS: 3.5x to 5x
This is the strongest performing category on Meta in India right now. Beauty brands benefit from highly visual products, strong impulse-buy behavior, and relatively high repeat purchase rates. Brands like Minimalist and Pilgrim have built massive scale on Meta by combining UGC-style creator content with aggressive offer testing.
Top performers in this category are hitting 5x to 6x blended ROAS, but they are also running 60 to 70% prepaid orders, which dramatically improves their effective ROAS after accounting for RTOs.
Key driver: Product education content. Short videos explaining ingredients, showing before-after results, and creator testimonials consistently outperform polished brand films.
Average blended ROAS: 2.5x to 4x
Fashion is trickier because of higher return rates and the fact that sizing concerns reduce impulse purchases. Brands like Snitch and Bewakoof have found their sweet spot by focusing on low-price-point impulse buys (Rs 500 to Rs 1,500) with strong visual hooks.
The ROAS range here is wide. Brands selling basics and everyday wear at low AOVs can hit 4x consistently. Premium fashion brands with Rs 2,500+ AOVs often struggle to cross 2.5x because the consideration period is longer and Meta’s algorithm optimizes better for high-volume, low-friction purchases.
Key driver: Carousel ads showcasing multiple products and lifestyle imagery. Video ads showing “outfit of the day” content from real customers outperform studio lookbooks by 30 to 40%.
Average blended ROAS: 2x to 3x
Food brands face a unique challenge on Meta: the product is perishable, shipping is expensive relative to the product cost, and AOVs tend to be low (Rs 400 to Rs 800). Brands in this space need to think in terms of customer lifetime value rather than first-purchase ROAS.
The best performers here, like brands in the health snacks and protein supplements space, push AOV up through bundles and subscriptions. A brand selling individual Rs 300 protein bars will struggle on Meta. The same brand selling a Rs 1,500 monthly subscription box can make the math work.
Key driver: Subscription and bundle offers. Brands that successfully push bundle AOVs above Rs 1,200 see their ROAS jump from the 1.5x to 2x range into the 2.5x to 3.5x range.
Average blended ROAS: 3x to 4.5x
This category has seen massive growth on Meta in India, particularly for ayurvedic and natural wellness products. The trust factor is critical here, which is why creator-led content featuring health practitioners and real user testimonials drives the best performance.
Brands in the supplements, immunity, and sexual wellness space are seeing strong ROAS because these products have high perceived value, decent margins, and strong repeat purchase behavior.
Key driver: Long-form UGC content (60 to 90 seconds) where creators explain the problem, share their experience, and show results. This format consistently delivers 20 to 30% lower cost per purchase compared to short, snappy ads.
Action step: Find your category benchmark from the list above. If your blended ROAS is more than 30% below the low end of your category range, your campaigns need a structural overhaul, not just creative refreshes.
ROAS is a ratio, and ratios can be misleading without understanding the absolute numbers behind them. Here are the cost metrics driving these benchmarks in India in 2026.
The average CPM for ecommerce campaigns in India on Meta ranges from Rs 50 to Rs 200 for feed placements. Reels placements tend to run 15 to 25% cheaper. During Q4 (October to December), expect CPMs to spike 30 to 60% due to festive season competition from every D2C brand and their agency running Diwali campaigns.
For context, this is one of the lowest CPM environments globally. US advertisers pay roughly Rs 1,900 per thousand impressions. This cost advantage is what makes Meta ads viable for Indian D2C brands with Rs 800 to Rs 1,500 AOVs.
Average CPC for ecommerce in India sits between Rs 5 and Rs 25, depending on the vertical and targeting. Beauty and fashion tend to be on the lower end (Rs 5 to Rs 15) because of high engagement rates. Health and wellness can push higher (Rs 15 to Rs 25) because the audience is smaller and more competitive.
This is the metric that actually matters. Across our portfolio, the average cost per purchase on Meta for Indian D2C brands in 2026 breaks down like this: Rs 250 to Rs 400 for beauty and personal care, Rs 300 to Rs 500 for fashion (under Rs 1,500 AOV), Rs 200 to Rs 350 for food and beverages (bundle offers), and Rs 350 to Rs 600 for health and wellness.
If your cost per purchase is eating more than 25 to 30% of your AOV, your unit economics are likely negative after factoring in COGS, shipping, and payment gateway charges.
Action step: Calculate your effective cost per purchase (factoring in RTOs) and compare it against 25% of your AOV. If it exceeds that, your problem is not ROAS. It is unit economics.
If you are still running fully manual campaign structures on Meta in 2026, you are leaving money on the table. Meta’s Advantage+ Shopping Campaigns (ASC) have become the default prospecting setup for serious D2C advertisers, and the data backs it up.
Meta’s internal data shows ASC outperforms manual campaigns by 17 to 32% on cost per purchase for ecommerce brands. From our own campaigns, we are seeing ASC deliver an average ROAS of 4.2x compared to 3.4x for equivalent manual campaign structures. That is roughly a 22% improvement.
Meta’s Andromeda algorithm update fundamentally changed how ad delivery works. The system now processes significantly more ad candidates per auction, which means it is better at finding your ideal buyer across Meta’s ecosystem. ASC gives the algorithm maximum freedom to do this by removing manual audience restrictions.
The key insight most brands miss: ASC needs creative diversity, not audience targeting. When you feed ASC 15 to 20 diverse creative assets (mixing UGC, static, carousel, and video formats), the algorithm can test combinations at a scale no human media buyer could match.
Here is the structure we use across our portfolio. Allocate 70% of your budget to ASC for prospecting and 30% to manual campaigns for retargeting (website visitors, add-to-cart audiences, past purchasers). Within ASC, maintain a minimum of 15 active creatives at any time. Let campaigns run for 5 to 7 days without changes so they exit the learning phase properly. Set your country targeting to India only and let Meta handle the rest.
Do not make the mistake of running five separate ASC campaigns at Rs 1L each. One consolidated ASC campaign at Rs 5L will outperform them every time because Meta’s algorithm needs consolidated budget to optimize effectively.
Action step: If you are spending more than Rs 5L per month on Meta and still running fully manual campaigns, migrate your prospecting spend to ASC this week. Start with 50% of your prospecting budget in ASC alongside your manual campaigns and compare performance over 14 days.
Want us to set up your Advantage+ campaigns? Book a free consultation.
Here is a truth that most D2C founders do not want to hear: your ROAS problem is almost never a targeting problem. In 2026, with Meta’s algorithm handling most targeting decisions automatically, ROAS is primarily a function of your creative strategy.
The brands in our portfolio hitting 4x+ ROAS consistently share one thing in common: they test a high volume of creatives every single week. We call this the Creative Velocity Framework.
Step 1: Produce 10 to 15 new creative assets per week. This sounds like a lot, but it is not when you break it down. You need 3 to 4 new UGC videos (shot by creators on their phones), 3 to 4 static ads (benefit-led, offer-led, and social proof variants), and 2 to 3 carousels (product showcase, before-after, or listicle format). The remaining 2 to 4 assets come from repurposing winners, taking a winning hook from a video and turning it into a static ad, or extracting the best frame from a video for a single-image ad.
Step 2: Test in a dedicated testing campaign. Run all new creatives in a separate testing campaign with a fixed daily budget (10 to 15% of your total ad spend). Use cost-per-purchase as your primary success metric. After 5 to 7 days and a minimum of 50 conversions per ad set, identify winners and losers.
Step 3: Graduate winners to your main ASC campaign. Any creative that beats your target cost per purchase by 10% or more gets moved into your main ASC campaign. Kill anything that is 20% or more above your target.
Step 4: Iterate on winners. When you find a winning creative, do not just celebrate. Dissect it. What was the hook? What was the offer? What format was it? Then create 5 to 7 variations of that winner, same concept but different hooks, different creators, different visual treatments.
boAt, one of India’s most successful D2C brands, rebuilt their entire performance strategy around creative velocity. They moved from monthly to weekly creative refresh cycles and started generating 15 to 20 variations per product using different openings, captions, and CTAs. The result was dramatically reduced creative fatigue and more consistent ROAS at scale.
Sugar Cosmetics discovered that raw, authentic UGC content from real users outperformed their expensive studio productions. The learning: modern consumers trust real people over perfect ads. Authenticity outperforms aesthetics in performance marketing.
Action step: Audit your current creative output. If you are producing fewer than 10 new creatives per week and spending more than Rs 5L per month, your creative pipeline is your biggest bottleneck. Download our free creative brief template to systematize your production process.
This is the section most agencies will not write because it makes their reported numbers look worse. But we believe in giving you the full picture.
Meta’s reported ROAS can differ from your actual ROAS by 20 to 40%. This gap exists because of three factors.
First, iOS 14+ privacy changes. Apple’s App Tracking Transparency framework means Meta cannot track a significant portion of conversions, particularly from iOS users. Meta’s Conversions API helps close this gap, but it is not perfect.
Second, view-through conversions. Meta’s default attribution window includes 1-day view conversions, meaning if someone saw your ad (even without clicking) and purchased within 24 hours, Meta takes credit. For high-awareness brands, this inflates reported ROAS.
Third, cross-device journeys. A customer sees your ad on Instagram on their phone, then purchases on their laptop later. Meta may or may not attribute this correctly depending on whether the user is logged in on both devices.
Use a blended MER (Marketing Efficiency Ratio) as your north star metric. Calculate it as total revenue divided by total ad spend across all channels. This eliminates attribution issues because it measures the overall impact of your marketing spend.
For Indian D2C brands, here is what healthy blended MER looks like by category: 3.5x to 5x for beauty and wellness, 2.5x to 4x for apparel, 2x to 3x for food and FMCG, and 3x to 4.5x for health and wellness.
Also, set up Meta’s Conversions API (CAPI) if you have not already. Brands running CAPI alongside the Meta pixel see 15 to 20% more attributed conversions, which gives you a more accurate picture of Meta’s actual contribution to revenue.
Action step: Calculate your blended MER for the last 30 days. Compare it against your Meta-reported ROAS. If the gap is larger than 25%, you likely have an attribution setup issue that needs fixing.
ROAS is not static. It fluctuates significantly throughout the year, and the brands that plan for these fluctuations outperform those that react to them.
From our data across 50+ campaigns, here are the seasonal patterns for Indian D2C brands on Meta.
January to March (Post-festive recovery): CPMs drop 20 to 30% from Q4 peaks. This is the best time to test new creatives and audiences. ROAS typically runs 15 to 20% above annual average. Smart brands use this window to build retargeting audiences cheaply for later scaling.
April to June (Pre-summer and wedding season): Steady performance. Fashion and beauty brands see a bump during wedding season. Food brands struggle as summer heat affects delivery quality. ROAS aligns closely with annual averages.
July to September (Back to school and independence day sales): Moderate competition. Electronics and fashion see spikes around August sales events. This is a good testing period before the Q4 ramp.
October to December (Festive season): CPMs spike 30 to 60%. Diwali, Navratri, and Christmas create massive purchase intent, but every brand is competing for the same eyeballs. Your ROAS may dip by 20 to 30% on a per-rupee basis, but absolute revenue and volume should increase significantly if your campaigns are well-structured.
Action step: Build a quarterly budget plan that allocates more testing budget to Q1 (January to March) when CPMs are lowest, and more scaling budget to Q4 when purchase intent is highest.
If your ROAS is below your category benchmark, work through this checklist in order. Each item builds on the previous one.
Action step: Score yourself on each of these five items. Fix them in order, spending at least one week on each before moving to the next.
A good ROAS depends on your category and AOV. For beauty and personal care, 3.5x to 5x is healthy. For fashion, 2.5x to 4x. For food, 2x to 3x. For health and wellness, 3x to 4.5x. These are blended numbers combining prospecting and retargeting. Your prospecting ROAS will always be lower (1.5x to 2.5x) while retargeting should be significantly higher (5x to 10x).
The most common reasons are creative fatigue (running the same ads for too long), budget fragmentation (too many campaigns splitting your spend), poor attribution setup (missing Conversions API events), and seasonal CPM increases (particularly during Q4). Start by checking your ad frequency. If any ad set shows frequency above 2.5, that is your most likely culprit.
Yes, if you are spending more than Rs 3L per month on Meta. ASC consistently outperforms manual campaigns by 17 to 32% on cost per purchase. The key is feeding it enough creative diversity (minimum 15 active assets) and giving it adequate budget in a single consolidated campaign. Brands spending under Rs 3L per month may find manual campaigns easier to control and optimize.
You need a minimum of 50 conversions per ad set per week to get statistically reliable performance data. For most Indian D2C brands with Rs 800 to Rs 1,500 AOVs and Rs 300 to Rs 500 cost per purchase, that means a minimum daily budget of Rs 3,000 to Rs 5,000 per ad set. If your total Meta budget is under Rs 3L per month, keep your campaign structure extremely simple (one prospecting campaign, one retargeting campaign) to concentrate your data.
Take your Meta-reported revenue, subtract the value of orders that were returned or RTO’d (typically 15 to 25% for COD-heavy brands), and divide by your total ad spend. This gives you your effective ROAS. For example, if Meta reports Rs 10L in revenue from Rs 2.5L in ad spend (4x ROAS), but 20% of orders are RTO’d, your effective ROAS is actually 3.2x. This is the number your unit economics should be built on.
The difference between D2C brands that scale profitably on Meta and those that burn through cash is not some secret targeting hack or a magic audience. It is having clear benchmarks, testing creatives relentlessly, and building campaigns that give Meta’s algorithm the data and creative fuel it needs to find your buyers.
If your ROAS is below the benchmarks we have shared here, you now have a clear checklist to work through. And if you would rather have a team that has done this across 50+ Indian D2C brands handle it for you, we are here.
Get a free Meta Ads ROAS audit for your D2C brand. Book a 15-minute call with our team.
Aim n Launch is a performance marketing agency based in Delhi, specializing in Meta ads for ecommerce, Shopify development, CRO optimization, and creative production for Indian D2C brands spending Rs 5L+ per month on ads.