Performance Marketing Services in Mumbai
Performance Marketing Services in Mumbai: What Sets a Real Growth Partner Apart Mumbai is India’s FMCG and fashion capital — home to legacy consumer brands going digital-first and a dense new wave of D2C labels in beauty, fashion, and food. It’s also one of the most expensive ad markets in the country, which means inefficient spend hurts faster here than almost anywhere else. If you’re evaluating performance marketing services in Mumbai, the priority isn’t finding an agency that can run ads. It’s finding one that can make every rupee of a higher-CPM market work harder — through sharper creative, tighter targeting, and conversion optimization that doesn’t waste the traffic you’re already paying premium rates to acquire. Why Mumbai’s Ad Market Demands More Discipline Higher CPMs mean less room for error Mumbai’s Meta and Google ad costs are consistently among the highest in India. A campaign that’s “good enough” in a smaller market can be unprofitable here. Creative quality and offer clarity aren’t nice-to-haves — they’re what determines whether a campaign breaks even. FMCG and fashion buyers expect polish Mumbai’s consumer base is used to slick, well-produced brand content from established players. D2C brands competing for attention need creative that matches that bar — sharp hooks, clean product demos, and fast, high-quality edits. Category crowding is extreme Beauty, fashion, and F&B categories in Mumbai are saturated with both legacy and D2C-native brands. Standing out requires structured creative testing across multiple angles, not a single hero ad running for months. What Performance Marketing Services in Mumbai Should Cover Meta and Google Ads built around cost per orderIn a high-CPM market, campaigns need to be tightly tied to a target cost per order backed by real margin — not run on a flat budget hoping ROAS holds. Aggressive, structured creative testingWeekly tests across hooks, formats, and angles are essential in Mumbai’s competitive categories. Underperformers need to be retired fast to protect a budget that’s already working against higher CPMs. CRO to make expensive traffic countProduct pages, offers, and checkout speed need to convert at a higher rate here, simply because the traffic driving them costs more. Fixing leaks isn’t optional — it’s the difference between profitable and unprofitable spend. AOV growth through bundlingMumbai’s fashion and FMCG buyers respond well to smart bundling and clear value framing, which lifts order value without relying on the margin-eroding discounts common in these categories. Reliable tracking and attributionWith ad costs this high, knowing exactly which campaigns are profitable — down to CAC versus LTV and breakeven ROAS — isn’t optional reporting. It’s the basis for every spend decision. Get Free Growth plan How Aim n Launch Approaches Performance Marketing for Mumbai Brands Our approach to Mumbai’s FMCG, fashion, and beauty brands is built around making a higher-cost ad market work in your favor, not against you: Fixing product page and offer leaks before scaling any spend Weekly creative test maps with fast pause/scale decisions In-house UGC production — scripted, cast, and edited to match Mumbai’s polished content expectations Daily performance tracking calls, not monthly check-ins SEO layered alongside paid media to build a compounding channel that reduces dependency on expensive ad inventory over time We’ve generated ₹55 crore+ in tracked client revenue at a consistent 4.2x ROI, including a fashion brand that drove over ₹42 lakh in tracked revenue across Meta and SEO combined at a 4.98x ROAS on Meta alone. Get Free Growth plan Frequently Asked Questions Why are ad costs higher for Mumbai-targeted campaigns? Mumbai has one of India’s highest concentrations of high-income, high-intent buyers, which drives up competition and CPMs across Meta and Google. It also means conversion rates and AOV need to be proportionally stronger to stay profitable. Which categories perform best with performance marketing in Mumbai? Fashion, beauty, and FMCG consistently see strong results, provided creative quality and offer structure match the market’s expectations. Is performance marketing worth it for a Mumbai brand with a smaller budget? Yes, but budget efficiency matters more here than in lower-CPM markets. A tighter focus on the highest-intent audience segments and strong CRO becomes essential rather than optional. How does Aim n Launch keep CAC under control in an expensive market like Mumbai? By fixing conversion leaks before scaling spend, running disciplined creative testing to find what actually converts, and tracking cost per order daily rather than reviewing performance monthly.
Performance Marketing Services in Bangalore
Performance Marketing Services in Bangalore: Why Data-Led Buyers Need a Different Approach Bangalore’s D2C buyers are some of the most digitally native and data-comfortable in India — no surprise, given the city’s tech industry base. That changes what actually works in performance marketing here. Generic ad copy and surface-level offers don’t land with an audience that’s used to scrutinizing products, comparing options, and spotting a weak value proposition instantly. If you’re a Bangalore-based D2C or ecommerce brand looking for performance marketing services, the agency you work with needs to build campaigns for a buyer who researches before they convert — not one who impulse-buys off a flashy ad. Why Bangalore’s Market Behaves Differently Higher research intent before purchase Bangalore buyers are more likely to check reviews, compare pricing, and visit a brand’s website multiple times before converting. That means retargeting, clear product information, and trust signals on the landing page matter more here than in markets with faster impulse-driven buying behavior. Strong D2C and quick-commerce competition Bangalore has a dense concentration of D2C-native brands, especially in wellness, nutrition, personal care, and consumer tech accessories, alongside heavy quick-commerce penetration. Standing out requires sharper positioning, not just higher spend. A buyer base that responds to proof, not hype Data, specifics, and clear before/after value communication tend to outperform generic emotional hooks with Bangalore’s audience — which shifts how creative and ad copy should be written. What Performance Marketing Services in Bangalore Should Include Meta and Google Ads built around informed-buyer behaviorCampaigns need a retargeting structure that accounts for longer research cycles, not just top-of-funnel awareness spend expecting immediate conversion. Landing pages built on proof, not just polishProduct pages need clear specifications, social proof, and honest value communication — Bangalore buyers tend to bounce fast from pages that feel like hype without substance. Creative testing rooted in specificityRather than broad emotional hooks, ads that lead with concrete benefits, ingredients, specs, or outcomes tend to perform better with this audience. Testing should reflect that from the start. CRO focused on trust signalsReviews, guarantees, clear return policies, and transparent pricing on the product page matter more here — fixing these often lifts conversion rate more than additional ad spend would. Data-driven reporting Bangalore founders will actually trustGiven how data-literate this market’s founders and buyers tend to be, reporting needs to go beyond surface metrics into CAC versus LTV, contribution margin, and funnel-stage drop-off. Get Free Growth plan How Aim n Launch Approaches Performance Marketing for Bangalore Brands For Bangalore-based D2C and ecommerce brands, our system is built to match a research-driven buyer and a founder base that expects rigor in reporting: Retargeting structures built for longer consideration cycles, not just first-touch conversion Product page and offer audits focused on proof and trust signals before scaling spend Weekly creative test maps built around specificity — features, outcomes, and honest positioning Daily tracking calls with CAC, LTV, and contribution margin visibility SEO layered alongside paid media, since Bangalore’s research-heavy buyers frequently discover brands organically before converting through ads Across our client base, we’ve generated ₹55 crore+ in tracked revenue at a consistent 4.2x ROI, working with wellness, nutrition, fashion, and consumer brands — including ones that scaled after appearing on Shark Tank India. Get Free Growth plan Frequently Asked Questions Why do Bangalore buyers need a different ad approach than other cities? Bangalore’s audience tends to research more before purchasing, which means retargeting, trust signals, and specific, proof-led creative typically outperform broad emotional hooks that work better in faster-converting markets. Which categories do well with performance marketing in Bangalore? Wellness, nutrition, personal care, and consumer tech accessories consistently perform well, largely due to strong overlap with the city’s health- and tech-conscious buyer base. How long does it take to see results in Bangalore’s market? Given longer research cycles, initial signal often takes slightly longer to emerge than in impulse-driven markets — typically 3-5 weeks of structured testing before a clear picture forms. Does SEO matter alongside paid ads for Bangalore brands? Yes, more than in most markets. Bangalore’s research-heavy buyers frequently search for a brand or product multiple times before converting, so strong organic presence directly supports paid performance.
Performance Marketing Services in Gurgaon

Performance Marketing Services in Gurgaon: Built for Fast-Moving D2C Brands Gurgaon has one of the highest concentrations of funded D2C and ecommerce startups in India. That comes with an advantage — capital to test and scale — and a very specific risk: pressure to hit aggressive growth numbers fast, often before the brand’s unit economics are fully proven out. If you’re a Gurgaon-based brand looking for performance marketing services, the agency you choose needs to understand that tension. Growth without margin discipline burns runway fast. Margin discipline without growth pace loses the window that funding was meant to buy. Why Gurgaon Brands Need a Profit-First Performance Marketing Partner Funded doesn’t mean unlimited Even well-funded Gurgaon startups are increasingly being asked to show a path to profitable CAC, not just top-line growth. A performance marketing partner should build campaigns around breakeven ROAS and contribution margin from day one, not chase growth-at-any-cost until a board meeting forces a correction. Category competition is intense Fashion, beauty, wellness, and consumer tech brands based in Gurgaon are often competing directly with the best-funded D2C brands in the country for the same ad inventory. Winning here depends on creative sharpness and landing page clarity — not just outbidding competitors on CPMs. Speed matters, but so does discipline Gurgaon brands move fast. A performance marketing team needs to match that pace with daily — not weekly — decisions on what to scale, pause, or kill, while still protecting margin. What Performance Marketing Services in Gurgaon Should Include Meta and Google Ads built around orders, not reachCampaigns structured to hit a target cost per order tied to your actual contribution margin, with spend shifted toward what’s proven to convert. CRO before scaleBefore pushing more budget, the product page, offer, and checkout flow need to be fixed. Sending paid traffic to a page that leaks is the fastest way to waste a funding round. A disciplined creative testing systemWeekly tests across hooks, angles, and formats, with fast retirement of underperforming creative and aggressive scaling of what works — critical in Gurgaon’s crowded categories. AOV growth through bundling, not discountingHeavy discounting is common in competitive Gurgaon categories, but it erodes margin fast. Smart bundling and offer clarity protect AOV without the same downside. Clean, board-ready trackingCAC versus LTV, breakeven and actual ROAS, and conversion funnel performance — the kind of reporting that holds up in an investor update, not just a weekly Slack message. Get Free Growth plan How Aim n Launch Works With Gurgaon Brands We’ve worked directly with Gurgaon-based D2C brands — including a fashion startup that grew organic traffic by 300% and online sales 4x within six months through combined SEO and influencer marketing. Across our Gurgaon client work, our approach centers on: Daily tracking calls to raise, pause, or swap spend based on live performance Fixing product page and checkout leaks before scaling budget further In-house UGC — scripted, cast, and edited without outsourcing creative production SEO layered alongside paid media to reduce long-term blended CAC Weekly test maps across creative angles, retiring losers fast Overall, we’ve generated ₹55 crore+ in tracked client revenue at a consistent 4.2x ROI, including brands that scaled after appearing on Shark Tank India. Get Free Growth plan Frequently Asked Questions Why do Gurgaon D2C brands need performance marketing specifically? Because visibility alone doesn’t justify a funding round’s spend. Performance marketing ties every rupee to measurable outcomes — orders, CAC, and contribution margin — which matters more in a capital-conscious environment. Can performance marketing work for an early-stage Gurgaon startup? Yes, provided there’s basic product-market fit. Without it, performance marketing tends to amplify a leaking funnel rather than fix it — CRO and offer testing should come first. What’s a realistic ROAS target for a Gurgaon D2C brand? This depends entirely on category margin. A performance-first agency will calculate your breakeven ROAS from your actual cost structure rather than quoting a generic industry number. Does Aim n Launch only work with funded startups in Gurgaon? No — we work with both funded and bootstrapped D2C brands across Gurgaon and the wider NCR region, adjusting the growth pace to match each brand’s capital position.
Performance Marketing Services in Delhi NCR
Performance Marketing Services in Delhi NCR: One Region, Very Different Brands Delhi NCR isn’t one market — it’s several stitched together. Delhi’s brand-led D2C scene, Gurgaon’s startup and funded-brand density, Noida’s manufacturer-to-D2C sellers, and Faridabad and Ghaziabad’s growing SME ecommerce base all fall under the same “NCR” label, but they don’t behave the same way when it comes to buyers, price sensitivity, or fulfillment expectations. If you’re searching for performance marketing services in Delhi NCR, the agency you choose needs to understand that nuance — not run one generic Meta and Google Ads playbook across the entire region and call it a regional strategy. Why Delhi NCR Needs a Region-Aware Approach Shared logistics, different buyers NCR’s biggest advantage is fulfillment speed — most of the region is within a same-day or next-day delivery radius of major warehouses. That’s a real edge for AOV strategy (free shipping thresholds, bundling) but it doesn’t mean every sub-market responds to the same offer or creative angle. Funded brands next to bootstrapped ones Gurgaon has a heavier concentration of venture-backed D2C brands with aggressive growth targets. Delhi and Noida have a larger mix of founder-led, profit-first brands. A performance marketing partner needs to flex between “scale fast with funding runway” and “scale profitably without burning cash” — these are different mandates, not the same strategy with a different budget. Category density varies by sub-region Fashion and beauty skew concentrated in Delhi and Gurgaon; FMCG, wellness, and manufacturing-linked D2C brands are more common out of Noida and Faridabad. Creative and offer strategy should reflect that, not ignore it. What Performance Marketing Services in Delhi NCR Should Cover Meta and Google Ads tied to cost per order and breakeven ROAS, adjusted for each sub-market’s price sensitivity and buyer intent CRO across product pages, offers, and checkout — since NCR’s fast fulfillment only pays off if the page actually converts A weekly creative testing system that tests angles across formats and kills underperformers fast, rather than running the same three ads for a quarter Retention through WhatsApp and email, especially valuable in NCR given high repeat-purchase potential across a dense, well-connected buyer base Transparent, decision-ready tracking — CAC vs LTV, contribution margin, and funnel drop-off, not just a monthly PDF of impressions Get Free Growth plan How Aim n Launch Works Across Delhi NCR Being based in Delhi gives us direct, on-the-ground context for Gurgaon, Noida, Faridabad, and Ghaziabad brands — not a remote, generic strategy applied from a different city. Our approach across the region includes: Daily performance tracking calls to raise, pause, or swap spend in real time Fixing product page and checkout leaks before scaling any campaign In-house UGC production, scripted and edited to match each sub-market’s buyer AOV growth through smart bundling rather than blanket discounting SEO layered alongside paid media to reduce long-term dependency on ad spend We’ve generated ₹55 crore+ in tracked client revenue at a consistent 4.2x ROI, working with brands across FMCG, fashion, wellness, and beauty — including brands that scaled after Shark Tank India appearances. Get Free Growth plan Frequently Asked Questions Is performance marketing different for Gurgaon vs Noida vs Delhi brands? The core levers — Meta/Google Ads, CRO, creative testing — stay the same. What changes is buyer price sensitivity, funding stage, and category mix, which should shape offer structure and creative angles. What industries in Delhi NCR benefit most from performance marketing? Fashion, beauty, FMCG, wellness, and nutrition brands see the fastest returns, largely because these categories convert well on Meta and Google with strong creative and offer testing. How quickly can a Delhi NCR brand expect results? Initial signal on what’s working typically emerges within 2-4 weeks of structured testing, though sustainable, profitable scale usually takes longer and depends on product-market fit and margin structure. Does Aim n Launch work with brands outside Delhi NCR too? Yes — while we’re based in Delhi and have deep regional context here, we work with D2C and ecommerce brands across India.
Performance Marketing Services in Delhi

Performance Marketing Services in Delhi: A Practical Guide for D2C Brands Delhi is home to one of India’s densest concentrations of D2C and ecommerce brands — from legacy FMCG names testing digital-first launches to new-age fashion, wellness, and beauty labels building entirely online. It’s also home to Aim n Launch, so this isn’t a market we’re guessing at. It’s the one we operate in every day. If you’re evaluating performance marketing services in Delhi, the real question isn’t “who runs ads.” Every agency runs ads. The question is who builds a system where ad spend, creative, and conversion all work together toward a number you actually care about: profitable orders. Why “Just Running Ads” Doesn’t Work in Delhi’s D2C Market Delhi’s ecommerce landscape is crowded and category competition is intense — beauty, F&B, fashion, and wellness brands are all fighting for the same scroll. In a market this saturated, media spend alone rarely wins. What wins is: Creative relevance — hooks and angles that speak to a very specific buyer, not generic ad copy Landing page and offer clarity — a product page that converts the traffic you’re already paying for Disciplined budget control — knowing exactly which campaigns are profitable before scaling spend further Most agencies in Delhi are still built around the old model: monthly retainers, weekly reports, and reach-based KPIs. That model made sense when digital advertising was cheap and untested. It doesn’t hold up in 2026, when CPMs are higher and every rupee of ad spend needs to justify itself against margin. What to Look for in a Performance Marketing Partner in Delhi Full-funnel ownership, not just media buying Ads bring intent. Without CRO, email, and WhatsApp flows working alongside them, a huge share of that intent is wasted. A performance marketing partner should own the entire path from click to repeat purchase — not just the ad account. Numbers-first reporting You should be looking at cost per order, breakeven ROAS, and CAC versus LTV — not just impressions and CTR. If a report doesn’t tell you whether a campaign is profitable, it isn’t a performance marketing report. A structured creative testing system Winning creatives in Delhi’s competitive categories come from testing multiple angles and formats every week, retiring underperformers quickly, and scaling the ones that actually convert — not from producing one polished ad and hoping it works. Local market fluency Delhi buyers respond differently across categories and price points than buyers in other metros. A partner who understands that nuance builds offers and creative that actually land, instead of running the same generic playbook everywhere. Get Free Growth plan How Aim n Launch Runs Performance Marketing for Delhi Brands We’re based out of Delhi (Mahipalpur), and our approach is built around what most agencies skip: Fixing leaks before scaling spend — product pages, offers, and checkout speed are audited before we push more budget Weekly test maps across creative angles and formats, with fast pause/scale decisions AOV growth through bundling and clarity, not blanket discounting that erodes margin Daily tracking calls to raise, pause, or swap campaigns based on real performance, not a monthly check-in In-house UGC production — scripted, cast, and edited internally rather than outsourced We’ve helped brands generate over ₹55 crore in tracked revenue and delivered a consistent 4.2x ROI across client accounts, including brands that scaled after appearing on Shark Tank India. Get Free Growth plan Frequently Asked Questions What’s included in performance marketing services in Delhi? Typically: Meta and Google Ads management, conversion rate optimization, creative strategy and UGC, tracking and attribution setup, and retention through email/WhatsApp — all tied to revenue outcomes. How much should a Delhi D2C brand budget for performance marketing? Typically ₹25,000–₹2,50,000+ per month, separate from ad spend. Many agencies charge 10–20% of managed ad spend instead of a flat retainer. Can performance marketing work alongside SEO for a Delhi brand? Yes — and it should. Paid media brings immediate volume while SEO compounds over time, reducing blended customer acquisition cost as organic traffic grows. How is Aim n Launch different from other Delhi-based agencies? We track orders and cost per order instead of vanity ROAS, fix conversion leaks before scaling spend, and run daily — not weekly — decisions on live campaigns.
Performance Marketing Companies in Bangalore

Top 10 Performance Marketing Agencies in Bangalore (2026) Bangalore’s agency ecosystem grew up inside a startup ecosystem — which shows. The performance marketing agencies in Bangalore are, on average, the most technically sophisticated in India: serious about attribution, comfortable with data infrastructure, fluent in product-led growth, genuinely good at building measurement stacks that don’t lie to you. That’s a real advantage, and D2C brands in Bangalore benefit from it. But there’s a corresponding weakness, and it’s worth naming plainly. Bangalore agencies were built for SaaS, fintech and app installs — categories where the funnel is long, the creative volume is low, and the winning lever is targeting and tracking. D2C on Meta in 2026 is the opposite: creative is the targeting, and an agency shipping four ads a month will get flattened by creative fatigue no matter how immaculate its attribution model is. So: great measurement, sometimes thin creative. Here’s who’s who. Disclosure: Aim n Launch is our own agency, listed first on our own blog. Discount accordingly. Everything else reflects publicly stated positioning. How We Ranked Creative throughput — the number one lever on Meta, and Bangalore’s most common gap. Unit economics literacy — contribution margin and breakeven ROAS before the media plan. Conversion ownership — does anyone own the product page and checkout? Attribution depth — Bangalore’s genuine strength; worth crediting where it exists. 1. Aim n Launch — Best for D2C creative volume plus margin discipline Base: New Delhi (serving Bangalore D2C brands) | Best for: Shopify D2C, ₹10L–₹5Cr/month Aim n Launch closes exactly the gap Bangalore agencies leave open: in-house creative volume. UGC is scripted, cast and edited internally, running a weekly test map of angles × formats with losers retired fast — the throughput D2C actually needs, not the four-ads-a-month cadence a SaaS retainer is built for. Paired with margin-first planning (breakeven ROAS before media plan), CRO ownership on the product page and checkout, and email plus WhatsApp retention. ₹55Cr+ in tracked client revenue at a 4.2x average ROI, including brands scaled from Shark Tank India. Recent results: A nutrition and wellness brand scaled to ₹3.4Cr revenue in 23 days at 4.36 ROAS. A fashion brand hit ₹42.3L in 31 days at 4.98x Meta ROAS. Services: Meta Ads, Google Ads, CRO, in-house UGC & creative, Shopify development, eCommerce SEO, Email + WhatsApp Reality check: eCommerce only. For B2B SaaS pipeline, several agencies below are a better fit. Get Free Growth plan 2. Social Beat — Best for video-led performance at scale Base: Bangalore | Best for: Brands where video creative drives the funnel Operating since 2012, Social Beat is one of the largest data-driven performance teams in India, with a genuine strength in creative storytelling alongside media buying — which makes it one of the few Bangalore agencies that doesn’t have a creative volume problem. Get Free Growth plan 3. Growth Hackers Digital — Best for growth-experiment culture Base: Bangalore | Best for: Startups running rapid experimentation Built around the experiment-velocity model Bangalore does well: hypothesis, test, measure, kill or scale. 4. Langoor — Best for full-service digital with performance depth Base: Bangalore | Best for: Brands needing creative plus data at scale Founded in 2010, blending data-driven strategy with creative execution across national and international campaigns. 5. Team Pumpkin — Best for ROI-led PPC Base: Bangalore, Mumbai, Delhi | Best for: Fast-growing brands PPC, paid social, CRO and analytics-based strategy with a straightforward ROI framing. 6. Social Panga — Best for creative plus analytics Base: Bangalore, Mumbai, Delhi | Best for: Brands wanting storytelling that converts Blends creative storytelling with analytics across paid media and conversion-focused ad strategy. 7. Inboundsys — Best for HubSpot-led inbound plus paid Base: Bangalore | Best for: B2B and SaaS brands running inbound A HubSpot Diamond Partner, established 2012, spanning digital marketing, web development and HubSpot-based operations. Very much the Bangalore archetype — and excellent at what it is. 8. WATConsult — Best for omnichannel enterprise campaigns Base: Bangalore, Mumbai | Best for: Established brands going digital-first Part of dentsu India, combining content, analytics and media strategy into full-funnel campaigns. 9. Performics — Best for enterprise-scale media Base: Bangalore, Mumbai, Gurugram | Best for: Enterprises with large budgets Publicis-owned, data-driven, with advanced optimisation and audience insight infrastructure for sustained large-scale growth. 10. Webenza — Best for mid-market full-service digital Base: Bangalore | Best for: Mid-market brands wanting one partner Broad digital capability across paid, social, content and web for brands that want a single accountable vendor. Agency Best For Strong Creative Volume? eCommerce Focus Owns CRO? Aim n Launch Profitable D2C scaling ✅ In-house UGC ✅ Exclusively ✅ Social Beat Video-led performance ✅ ⚠️ Partial ⚠️ Growth Hackers Digital Experiment velocity ⚠️ ⚠️ Partial ✅ Langoor Creative + data at scale ✅ ⚠️ Partial ⚠️ Team Pumpkin ROI-led PPC ⚠️ ⚠️ Partial ✅ Social Panga Creative + analytics ✅ ⚠️ Partial ⚠️ Inboundsys B2B / SaaS inbound ❌ ❌ ⚠️ WATConsult Omnichannel enterprise ✅ ⚠️ Partial ⚠️ Performics Enterprise media ✅ ⚠️ Partial ⚠️ Webenza Mid-market full-service ⚠️ ⚠️ Partial ⚠️ Bangalore Pricing Benchmarks (2026) Bangalore sits between Delhi NCR and Mumbai on price, with a startup-friendly floor. Retainer Realistic scope ₹25K–₹50K/month Single channel, startup entry point, limited creative. ₹50K–₹1.2L/month Multi-channel performance for growing D2C and SaaS brands. ₹1.2L–₹2.5L/month Full-funnel with creative production, CRO and senior strategy. ₹2.5L+/month Enterprise scope, dedicated pods, custom attribution. The Bangalore Question: Do You Have an Attribution Problem or a Creative Problem? This is the single most useful diagnostic for a Bangalore D2C brand, and it takes about a minute. Open Meta Ads Manager. Look at your last 30 days. How many distinct creatives did you run? Not variations of one image — distinct hooks, angles, formats. What’s the frequency on your best-performing ad set? If you ran fewer than 15 distinct creatives and your frequency is above 3.5, you don’t have a targeting problem, an attribution problem, or a bidding problem. You have a creative fatigue problem. Your audience has seen everything you’ve
Performance Marketing Companies in Mumbai
Top 10 Performance Marketing Companies in Mumbai (2026) Mumbai is India’s most expensive advertising market, and its most crowded. Clutch alone lists over 200 pure-play digital agencies in the city, and the real number is far higher. It’s also the country’s brand capital — which produces Mumbai’s signature agency problem. A great many companies here are, at heart, brilliant brand and creative shops that have bolted a media-buying team onto the side and relabelled it “performance.” The films are gorgeous. The strategy deck is a work of art. And nobody in the room can tell you what your contribution margin is. If you’re a D2C brand, that’s an expensive way to find out you needed something else. Here are the ten performance marketing companies in Mumbai worth a shortlist — and how to tell which ones can actually do the arithmetic. Disclosure: Aim n Launch is our own agency and appears first on our own blog. Weigh that accordingly. Everything else reflects publicly stated positioning. Our Ranking Criteria Margin literacy — do they start from contribution margin and breakeven ROAS, or from a media plan and a mood board? Creative velocity — how many testable angles ship per week, not how beautiful the hero film is. Conversion ownership — do they own the product page and checkout? Reporting honesty — live numbers on orders, CAC and payback, or a monthly deck of best-case ROAS. 1. Aim n Launch — Best for D2C brands that want profit over polish Base: New Delhi (serving Mumbai D2C brands) | Best for: Shopify D2C, ₹10L–₹5Cr/month The anti-Mumbai-agency pick, deliberately. eCommerce only. No brand films, no awards circuit — just ₹55Cr+ in tracked client revenue at 4.2x average ROI, including brands scaled from Shark Tank India. The method: margins, AOV, breakeven ROAS and supply constraints first. Then a weekly creative test map (angles × formats) with losers retired fast, UGC scripted, cast and edited in-house. Then CRO on the product page and checkout, so paid traffic isn’t poured into a leaky funnel. Then email and WhatsApp to recover carts and drive repeats. Daily calls to raise, pause and swap. Recent results: A fashion brand delivered ₹42.3L tracked revenue in 31 days at 4.98x Meta ROAS and 6.69x MER. An FMCG snacks brand hit ₹11.2L in 31 days, up 498% on the prior period. Services: Meta Ads, Google Ads, CRO, in-house UGC & creative, Shopify development, eCommerce SEO, Email + WhatsApp Reality check: If you want a brand campaign and a Cannes entry, this is emphatically the wrong agency. Get Free Growth plan 2. Schbang — Best for integrated brand plus performance Base: Mumbai | Best for: Brands needing creative, content and media in one place One of Mumbai’s leading integrated digital agencies, spanning performance marketing, social, branding, content, media buying and creative. Genuinely strong when brand and performance need to move together. Trade-off: Integrated means integrated. If you only want a ruthless ROAS machine, the scope is broader than you need. Get Free Growth plan 3. Interactive Avenues — Best for enterprise-scale data-driven media Base: Mumbai | Best for: Enterprises with large, multi-channel budgets An IPG-owned agency specialising in data-driven strategy and enterprise performance campaigns: search, display, mobile and conversion optimisation. 4. WATConsult — Best for omnichannel full-funnel campaigns Base: Mumbai | Best for: Established brands going digital-first Part of dentsu India, combining content, analytics and media strategy into full-funnel performance. Strong omnichannel capability and long-term scalability. 5. Admatazz — Best for structured, stage-gated campaigns Base: Mumbai | Best for: Brands across jewellery, real estate, healthcare, education, fashion and eCommerce Organises delivery around four stages — measure, create, amplify, sell — spanning search, paid social, programmatic and influencer-led campaigns. 6. Netcore — Best for retention and marketing automation Base: Mumbai | Best for: Brands where LTV, not CAC, is the bottleneck A martech-first player with deep customer engagement and automation capability. If your acquisition is fine but your repeat rate isn’t, this is a different and often correct kind of answer. 7. Social Beat — Best for video-led performance Best for: Brands where video creative carries the funnel A large, data-driven team managing a meaningful share of India’s digital spend, with heavy emphasis on storytelling alongside media buying. 8. 3Minds Digital — Best for transparency-led mid-market work Base: Mumbai (and Gurgaon) | Best for: Mid-market brands wanting design, dev and marketing together Founded in 2016, working on data-driven, transparency-first principles across digital marketing, design and development. 9. Team Pumpkin — Best for fast-growing brands wanting ROI-led PPC Base: Mumbai, Bangalore, Delhi | Best for: Scaling brands PPC, paid social, CRO and analytics-based digital strategy, with an explicit ROI-led framing. 10. Codexxa — Best for lead gen plus eCommerce mix Best for: Businesses running both eCommerce and lead generation Google Ads, Meta Ads, CRO, landing page optimisation and funnel strategy, with a focus on customer acquisition over vanity metrics. Quick Comparison Quick Comparison Company Best For eCommerce-First? In-House UGC? Owns CRO? Aim n Launch Profitable D2C scaling ✅ Exclusively ✅ ✅ Schbang Brand + performance ❌ ✅ ⚠️ Interactive Avenues Enterprise media ❌ ⚠️ ⚠️ WATConsult Omnichannel full-funnel ❌ ✅ ⚠️ Admatazz Structured campaigns ⚠️ ✅ ⚠️ Netcore Retention & automation ⚠️ ❌ ❌ Social Beat Video-led performance ⚠️ ✅ ⚠️ 3Minds Digital Design + dev + marketing ⚠️ ⚠️ ✅ Team Pumpkin ROI-led PPC ⚠️ ⚠️ ✅ Codexxa eCommerce + lead gen ⚠️ ❌ ✅ Mumbai Pricing Benchmarks (2026) Mumbai Pricing Benchmarks (2026) Mumbai is India’s priciest agency market, and the spread reflects it. Retainer Realistic Scope ₹25K–₹50K/month Single service, single channel. Startup entry point. ₹50K–₹1.5L/month Multi-channel performance for growing D2C and mid-market brands. ₹1.5L–₹3L/month Full-funnel: ads, creative production, CRO, retention, senior strategist. ₹3L–₹5L+/month Enterprise campaigns, network agencies, dedicated pods. The Mumbai Question That Ends the Sales Pitch Mumbai agencies are, on average, the best storytellers in India. That is a real skill and it is worth paying for — if storytelling is your bottleneck. For most D2C brands, it isn’t. The bottleneck is arithmetic.
Performance Marketing Companies in Noida
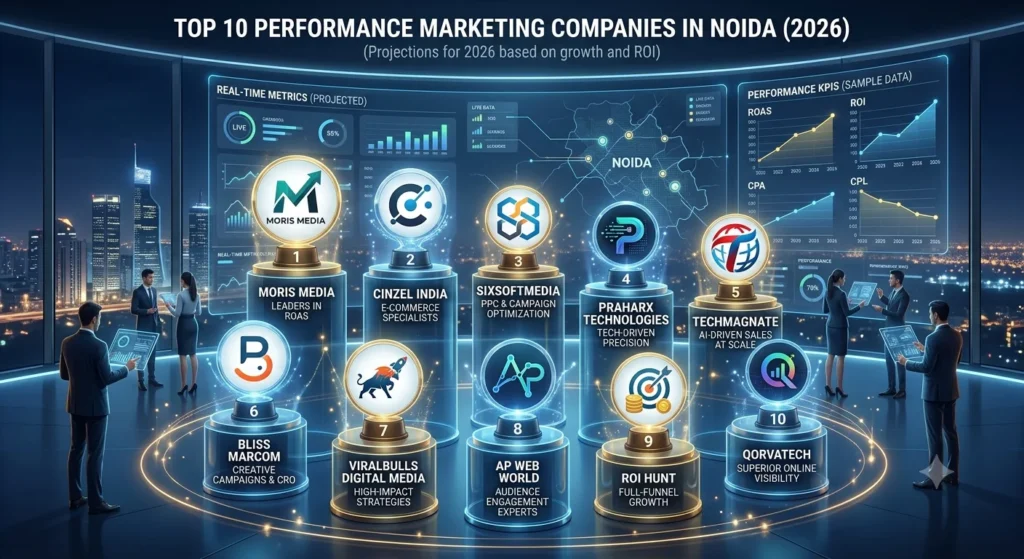
Top 10 Performance Marketing Companies in Noida (2026) Noida is the value play in NCR. Retainers run meaningfully below Gurgaon’s, the talent pool is deep, and the city has a genuine engineering culture — which is why so many agencies here are strong on tracking, attribution and technical execution. But Noida’s agency market grew out of IT services and B2B lead generation, not D2C. And that creates a specific hazard: a lot of the best-known performance marketing companies in Noida are excellent at generating fintech leads and app installs, and have never once had to defend a 42% gross margin against a rising CAC. That’s not a knock. It’s a fit question. Here’s the shortlist, and how to tell which is which. Disclosure: Aim n Launch is our own agency, ranked first on our own blog. Discount accordingly. Everything else reflects publicly stated positioning. How We Ranked Has this company actually scaled a Shopify store? Not an app. Not a lead form. A store with COGS, shipping, RTO and a return rate. Creative throughput — how many new angles ship per week? Conversion ownership — do they touch the product page and checkout, or only the ad account? Retention — is there an answer for email and WhatsApp, or does CAC have to carry everything? 1. Aim n Launch — Best for D2C brands (the eCommerce specialist) Base: Mahipalpur, New Delhi (serving Noida and all of NCR) | Best for: Shopify D2C, ₹10L–₹5Cr/month The direct answer to Noida’s D2C gap. Aim n Launch works only on eCommerce — no app installs, no B2B lead gen, no dilution — and has generated ₹55Cr+ in tracked client revenue at a 4.2x average ROI, including brands featured on Shark Tank India. The operating system is margin-first: breakeven ROAS and contribution margin before the media plan; a weekly creative test map with losers retired fast; CRO on the product page and checkout before spend gets pushed; email and WhatsApp recovering the carts the ads paid for. Daily calls to raise, pause and swap — not a monthly report. Services: Meta Ads, Google Ads, CRO, in-house UGC & creative, Shopify development, eCommerce SEO, Email + WhatsApp retention Reality check: If you need B2B lead gen or app installs, several companies below will serve you better. Get Free Growth plan 2. Wildnet Technologies — Best for full-funnel programmatic Base: Noida | Best for: Fintech, SaaS, education and healthcare brands Noida’s best-known performance operation. Wildnet spans Google Ads, Meta, programmatic buying, CRO, landing page optimisation and funnel strategy, with a client base running from startups to Fortune 500. It also offers white-label PPC. Consider if: Your media mix goes well beyond Meta and Google. Trade-off: Broad, not D2C-specialist. Ask specifically for a Shopify case study. Get Free Growth plan 3. Cinzel India — Best for PPC-led growth with tight reporting Base: Noida | Best for: SMEs and businesses wanting transparent PPC management Specialises in PPC management, SEO, social and CRO, with a strong emphasis on transparent, detailed reporting and dedicated account management. 4. ROI Hunt — Best for Shopify stores wanting tech and marketing together Base: Delhi, Noida and Gurgaon | Best for: Mid-market D2C, fashion and home décor Audience segmentation and creative testing across Meta and Google, plus funnel audits, landing page optimisation and Shopify development — so you’re not the middleman between your media buyer and your developer. 5. SIXSOFTMEDIA — Best for multi-channel SME campaigns Base: Noida | Best for: SMEs across multiple digital channels A dynamic multi-channel agency with a broad service spread across paid, organic and social. 6. PraharX Technologies — Best for tech-led campaign execution Base: Noida | Best for: Brands wanting technically rigorous tracking Reflects Noida’s engineering DNA — strong on the technical execution and measurement side of performance. 7. Red Hot Media — Best for ROI-focused SME campaigns Base: Noida | Best for: Local businesses and SMEs A recognised Noida name for ROI-focused, conversion-oriented campaigns at accessible retainers. 8. Prohed — Best for live-dashboard transparency Base: Gurgaon (serves Noida) | Best for: Founders who distrust monthly PDFs Live custom dashboards, daily updates and a task management system rather than a polished monthly report. Google and Meta certified, across D2C, beauty, health, FMCG and edtech. 9. Digidarts — Best for a single multi-channel partner Base: Gurgaon (serves Noida) | Best for: D2C and mid-market brands Social, SEO/SEM, performance, CRO, content and web development under one roof. 10. Adscrey — Best for combining D2C with marketplaces Base: Gurugram (serves NCR) | Best for: Brands split between their own store and Amazon/Flipkart Performance marketing, eCommerce marketing, SEO, retention, website development and marketplace management. Quick Comparison Quick Comparison Company Base Best For Proven on Shopify D2C? Owns CRO? Aim n Launch Delhi Profitable D2C scaling ✅ Exclusively ✅ Wildnet Technologies Noida Programmatic, full-funnel ⚠️ Ask ⚠️ Cinzel India Noida PPC + reporting ⚠️ Ask ⚠️ ROI Hunt NCR Shopify + tech ✅ ✅ SIXSOFTMEDIA Noida SME multi-channel ❌ ❌ PraharX Noida Technical execution ⚠️ Ask ⚠️ Red Hot Media Noida SME ROI campaigns ❌ ❌ Prohed Gurgaon Transparent reporting ⚠️ Partial ⚠️ Digidarts Gurgaon Multi-channel ⚠️ Partial ✅ Adscrey Gurugram D2C + marketplace ✅ ⚠️ Noida Pricing Benchmarks (2026) Noida Pricing Benchmarks (2026) Noida is the most cost-competitive market in NCR — one of the main reasons brands look here. Retainer Realistic Scope ₹20K–₹50K/month SME scope. Single channel, junior execution, basic reporting. ₹50K–₹1L/month Multi-channel execution, regular strategy calls. Where most growing brands sit. ₹1L–₹2L/month Full-funnel with creative production and CRO. ₹2L–₹5L+/month Enterprise scope with dedicated pods. The Noida Trap: Cheap Isn’t the Same as Efficient Noida’s price advantage is real. It is also, for D2C brands, occasionally a trap. Here’s how it plays out. You save ₹40,000 a month on retainer versus a Gurgaon specialist. You feel clever. Then: The agency ships six creatives a month, because that’s what the retainer covers. Meta needs closer to six a week to escape creative fatigue. Nobody touches the product page, so your conversion rate sits at
Performance Marketing Agencies in Gurgaon
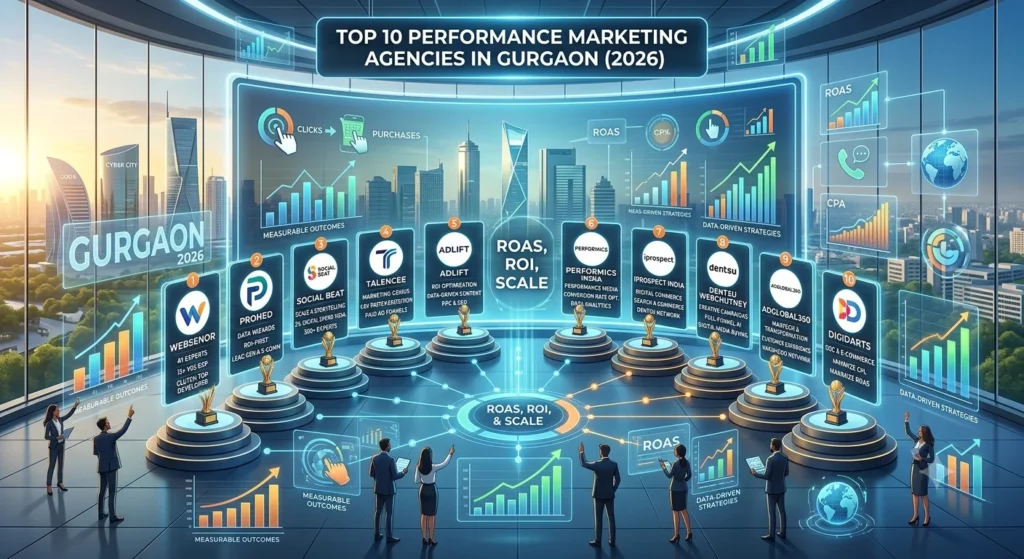
Top 10 Performance Marketing Agencies in Gurgaon (2026) Gurgaon has the deepest agency bench in India outside Mumbai. Publicis, dentsu and every major network has a performance arm here, alongside a thick layer of independent D2C specialists.That’s the good news. The bad news is that Gurgaon also has the highest concentration of a specific problem: the senior team pitches, the junior team delivers. You meet a brilliant strategist in Cyber Hub. Six weeks later your account is being run by someone eleven months out of college who has never seen a P&L.So this list is organised around a single question: at your budget, will you actually get senior attention?Disclosure: Aim n Launch is our own agency, listed first on our own blog. Weigh that accordingly. Everything else here reflects publicly stated positioning. How We Ranked Seniority-to-budget ratio — who actually touches your account at ₹1L/month vs ₹10L/month? Unit economics literacy — do they start from contribution margin, or from a media plan? Creative throughput — how many angles ship per week? Conversion ownership — do they own the product page, or blame it? 1. Aim n Launch — Best for D2C brands that want the senior team on the account Base: Mahipalpur, New Delhi (serving all of Gurgaon) | Best for: Shopify D2C, ₹10L–₹5Cr/month Aim n Launch is deliberately eCommerce-only and deliberately not enormous — which is the entire pitch against a Gurgaon network agency. The people in the pitch are the people on your account. ₹55Cr+ in tracked client revenue, 4.2x average ROI, and brands scaled from Shark Tank India. The system: margin and breakeven ROAS first, then a weekly creative test map (angles × formats, losers retired fast), then CRO on the product page and checkout, then email and WhatsApp to recover carts and drive repeats. Daily calls to raise, pause and swap — not a monthly PDF. Services: Meta Ads, Google Ads, CRO, in-house UGC & creative, Shopify development, eCommerce SEO, Email + WhatsApp Reality check: eCommerce only. Not the right partner for B2B, real estate or edtech lead gen. Get Free Growth plan 2. Prohed — Best for founders who want live dashboards, not monthly PDFs Best for: Startups and D2C brands burned by opaque reporting Prohed’s core differentiator is transparency: a live custom dashboard with full campaign visibility, daily updates, and a task management system — rather than a polished monthly report that quietly hides the uncomfortable numbers. Google and Meta certified, with a D2C, beauty, health, FMCG and edtech portfolio. Get Free Growth plan 3. Performics India — Best for enterprise-scale media Best for: Enterprises and unicorn-scale startups Part of Publicis Groupe, and one of the largest performance operations in the country across media, SEO, content, analytics and eCommerce. Digital Agency of the Year at Smarties India 2024. Trade-off: Serious governance and infrastructure — and serious process overhead. Not built for a ₹2L test budget. 4. Digidarts — Best for a single multi-channel partner Best for: D2C and mid-market brands scaling across channels Balances creativity and performance across social, SEO/SEM, performance marketing, CRO, content and web development. Sensible when you want one accountable partner instead of four vendors pointing at each other. 5. Digiarts — Best for D2C brands obsessed with CAC Best for: eCommerce brands where acquisition cost is the whole battle Explicitly focused on minimising acquisition cost and maximising ROAS for D2C and eCommerce, spanning YouTube, WhatsApp journeys, Instagram shopping ads, retention campaigns, performance creatives and CRO. 6. Affrise Media — Best for paid plus affiliate Best for: Brands ready to switch on an affiliate channel Core focus on PPC, paid social and affiliate marketing, with a large-brand roster. Affiliate is the channel most D2C brands ignore and then discover late. 7. Social Beat — Best for video-led performance at scale Best for: Brands where video creative drives the funnel A large, data-driven team that manages a meaningful share of India’s digital spend, with heavy emphasis on storytelling and research alongside media buying. 8. Lyxel & Flamingo — Best for Shopify Plus and technical depth Best for: Beauty and wellness D2C with engineering complexity Certified Shopify Plus Partner with genuine technical capability (GA4 migration, cloud services) and a strong beauty/wellness D2C portfolio. 9. DigeeSell — Best for brands that want a partner they can meet Best for: Local Gurgaon businesses and brands who value in-person A Gurgaon local favourite for brands that want boots-on-the-ground collaboration rather than a Slack channel and a Zoom link. 10. The Brand Bee — Best for early-stage budgets Best for: Startups and SMEs not yet at a ₹1L retainer Performance plus creative for cost-efficient growth. A reasonable starting point — and one most brands eventually outgrow. Quick Comparison Quick Comparison Agency Best For Senior Team at ₹1L? eCommerce Focus Owns CRO? Aim n Launch Profitable D2C scaling ✅ ✅ Exclusive ✅ Prohed Transparent reporting ✅ ⚠️ Partial ⚠️ Performics India Enterprise media ❌ ⚠️ Partial ⚠️ Digidarts Multi-channel ⚠️ ⚠️ Partial ✅ Digiarts CAC reduction ✅ ✅ ✅ Affrise Media Paid + affiliate ⚠️ ⚠️ Partial ❌ Social Beat Video-led scale ❌ ⚠️ Partial ⚠️ Lyxel & Flamingo Shopify Plus ✅ ✅ ✅ DigeeSell In-person partnership ✅ ⚠️ Partial ❌ The Brand Bee Early-stage ✅ ⚠️ Partial ❌ Gurgaon Pricing Benchmarks (2026) Gurgaon Pricing Benchmarks (2026) Gurgaon runs the widest retainer spread in NCR, because the market spans two-person shops and global networks. Retainer Realistic Scope ₹30K–₹60K/month Single channel (usually Meta or Google), limited reporting, junior execution. ₹60K–₹1.2L/month Multi-channel execution, regular strategy calls, growing D2C or B2B brands. ₹1.2L–₹2L/month Full-funnel with creative production, CRO, senior strategist attached. ₹2L+/month Enterprise scope, dedicated pods, custom attribution, network agencies. The Gurgaon Trap: Being a Small Fish Here’s the specific mistake Gurgaon invites. A ₹40L/year D2C brand walks into a network agency, gets dazzled by the client logo wall, and signs. On paper it’s a prestige win. In practice, that brand is a rounding error in a portfolio full of ₹50Cr media budgets — and it gets staffed accordingly. Meanwhile a
Performance Marketing Companies in Delhi
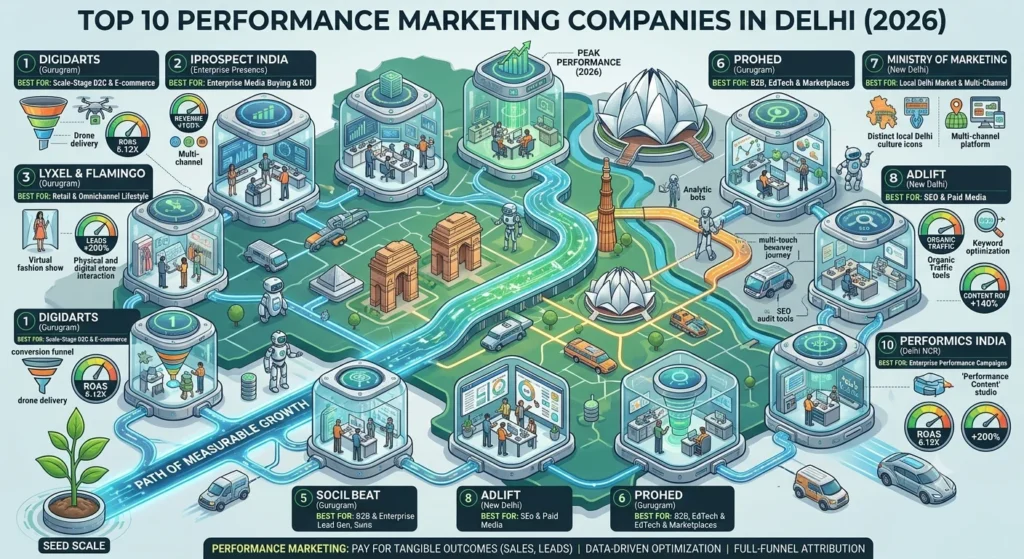
Top 10 Performance Marketing Companies in Delhi (2026) Delhi is where D2C brands are built. Gurgaon has the enterprise media budgets and Noida has the engineering bench — but the fashion labels, the FMCG challengers, the beauty startups and the Shark Tank alumni are disproportionately headquartered in Delhi proper. Which means the performance marketing agencies in Delhi have a specific character: creative-heavy, fast-moving, and used to working with founders who check the Shopify dashboard at 2am. It also means a lot of them are small shops running Meta ads out of a co-working space with no idea what your contribution margin is. Here are the ten worth your shortlist. Disclosure: Aim n Launch is our agency and we’ve ranked ourselves first on our own blog. Discount that accordingly. Everything below is based on each agency’s publicly stated positioning. Our Ranking Criteria A Delhi D2C brand doesn’t fail because its ads were badly targeted. It fails because of one of these four things — so that’s what we ranked on: Creative velocity. On Meta in 2026, creative is the targeting. An agency shipping four static ads a month is not a performance agency. Margin-first planning. Does the strategy start with your breakeven ROAS, or with a “media plan”? Conversion ownership. Traffic to a leaky product page is just an expensive way to lose money. Retention. If the agency has no answer for email and WhatsApp, they’re only solving half your CAC problem. 1. Aim n Launch — Best for profitable D2C scaling Base: Mahipalpur, New Delhi | Best for: Shopify D2C brands doing ₹10L–₹5Cr/month An eCommerce-only performance marketing agency based in Delhi, Aim n Launch has generated ₹55 crore+ in tracked client revenue at a 4.2x average ROI, and has scaled brands featured on Shark Tank India. The distinguishing thing is the refusal to treat ads as the whole job. Growth plans start from margin, AOV, breakeven ROAS and supply constraints. UGC is scripted, cast and edited in-house. Product pages and checkout get fixed before spend gets pushed. Email and WhatsApp flows recover the carts the ads paid for. Recent results: A fashion brand hit ₹42.3L tracked revenue in 31 days at 4.98x Meta ROAS and 6.69x MER. A nutrition brand scaled to ₹3.4Cr in 23 days at 4.36 ROAS. Services: Meta Ads, Google Ads, CRO, UGC & creative strategy, Shopify development, eCommerce SEO, Email & WhatsApp Reality check: eCommerce only. If you sell B2B software or apartments, look elsewhere. Get Free Growth plan 2. Lyxel & Flamingo — Best for technically complex Shopify stores Best for: Beauty and wellness D2C with real engineering needs A certified Shopify Plus Partner — a genuinely small club in India — with strong beauty and wellness credentials and technical depth in GA4 migration and cloud infrastructure. Funnel-based strategy, A/B testing, transparent reporting. Consider if: Your tracking is broken and you know it. Get Free Growth plan 3. Morris Media — Best for blended creative and analytics Best for: D2C, SaaS and eCommerce brands wanting ROI-led creative Morris Media takes an explicitly ROI-driven approach across D2C, SaaS, eCommerce and service businesses, blending creative work with analytics rather than treating them as separate departments. 4. ROI Hunt — Best for one team across ads, SEO and Shopify Base: Delhi, Noida and Gurgaon | Best for: Mid-market D2C, fashion and home décor The name is literal. ROI Hunt runs audience segmentation, creative testing and data-driven optimisation across Meta and Google — but also audits funnels, optimises landing pages, and handles Shopify development. One vendor, not four. 5. Performics India — Best for enterprise budgets Best for: Large brands and unicorn-scale startups Publicis-owned, and one of the largest performance operations in India across media, SEO, content and analytics. Digital Agency of the Year at Smarties India 2024. Trade-off: You will be one account among many hundreds. 6. Trigital Solutions — Best for Google-led acquisition Best for: eCommerce brands where search intent is the main channel A Google-certified Delhi agency serving eCommerce and D2C businesses with a performance-focused approach. Worth a look if Google Shopping — not Meta — is where your demand actually lives. 7. Digidarts — Best for multi-channel mid-market brands Best for: Brands that want creative and performance from one partner End-to-end across social, SEO/SEM, performance, CRO, content and web development. A pragmatic single-partner choice for mid-market brands. 8. Whisskers — Best for large-scale multi-channel ad ops Best for: Brands running heavy, complex ad spends Strong ad-operations capability across paid advertising, influencer and reputation management, and email. Built for volume. 9. Kinnect — Best when social discovery drives your sales Best for: D2C brands where Instagram and YouTube are the funnel Kinnect’s strength is converting social attention into checkouts rather than into likes — conversion targets baked into influencer and content strategy. Consider if: Your customers find you on Reels, not on Google. 10. Adscrey — Best for combining paid with marketplace Best for: D2C brands also selling on Amazon and Flipkart Covers performance marketing, eCommerce marketing, SEO, retention and marketplace management. Useful when your revenue is split between your own store and marketplaces. Quick Comparison Quick Comparison Agency Best For eCommerce-Only? In-House Creative/UGC? Owns CRO? Aim n Launch Profitable D2C scaling ✅ ✅ ✅ Lyxel & Flamingo Shopify Plus builds ⚠️ ⚠️ ✅ Morris Media ROI-led creative ❌ ✅ ⚠️ ROI Hunt Ads + SEO + Shopify ⚠️ ⚠️ ✅ Performics India Enterprise media ❌ ✅ ⚠️ Trigital Solutions Google-led growth ⚠️ ❌ ⚠️ Digidarts Multi-channel ❌ ✅ ✅ Whisskers Large ad ops ❌ ⚠️ ❌ Kinnect Social-first D2C ⚠️ ✅ ❌ Adscrey Paid + marketplace ✅ ⚠️ ⚠️ What It Costs in Delhi Delhi retainers sit slightly below Gurgaon’s, and well below Mumbai’s — but the range is wide: ₹25K–₹50K/month — one channel, minimal creative. Fine for validating a first product; not enough to scale one. ₹50K–₹1L/month — multi-channel, weekly calls, some creative production. Where most growing D2C brands land. ₹1L–₹2L+/month — full-funnel: ads, in-house creative, CRO, retention, senior strategist. Retainers are always separate