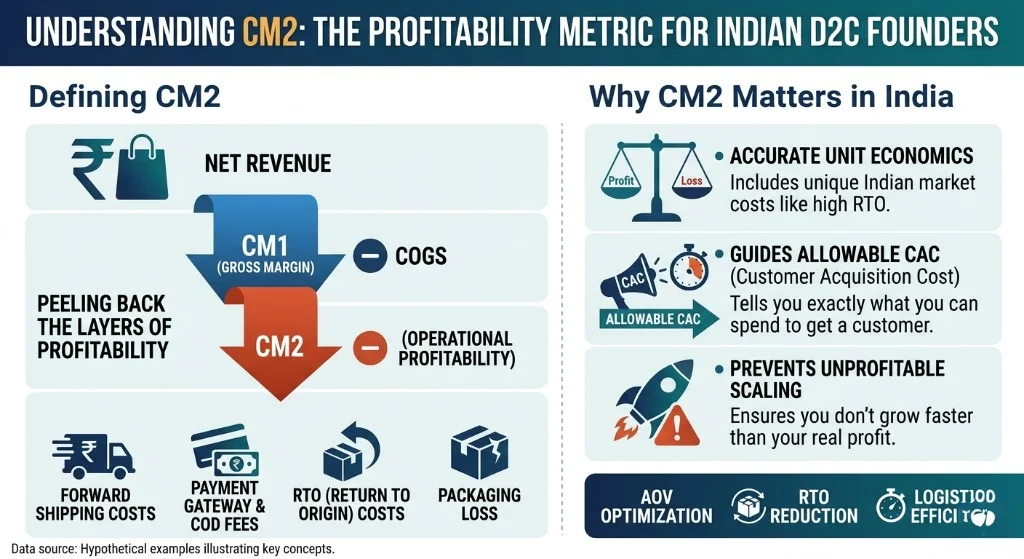
CM2 stands for Contribution Margin 2. It is the profit left over from an order after you subtract product cost, packaging, shipping, payment gateway fees, returns, AND customer acquisition cost.
Here is the formula:
CM2 = Revenue per Order – COGS – Packaging – Shipping – Payment Gateway Fee – Return Cost Allocation – Customer Acquisition Cost (CAC)
The critical difference between CM2 and gross margin is that CM2 includes your ad spend. Gross margin tells you “is the product itself profitable.” CM2 tells you “is the business of selling this product to a customer you acquired through ads profitable.”
This matters because in Indian D2C, ad spend is typically your single largest variable cost. For most brands spending Rs 5-20L/month on Meta and Google, ad spend represents 25-40% of revenue. If you are not factoring that into your per-order profitability calculation, you are flying blind.
Consider this real scenario from a beauty brand we audited in Delhi (numbers anonymized):
Looks great, right? 80% gross margin. Now let us add the real costs:
CM2 = Rs 899 – 180 – 45 – 95 – 18 – 85 – 550 = negative Rs 74
This brand was losing Rs 74 on every single order they acquired through paid ads, despite having an “80% gross margin.” They had been running this way for 14 months, burning through their seed funding, celebrating revenue growth while bleeding cash on every transaction.
Let us walk through each component with realistic Indian D2C numbers.
Do not use your catalogue price. Use your real blended AOV after discounts, coupons, and bundling. For Indian D2C, typical AOVs by category:
This includes raw materials, manufacturing, and any direct production costs. Indian D2C COGS benchmarks:
Important: Calculate COGS against your actual selling price (after discount), not MRP. If your MRP is Rs 999, your COGS is Rs 200, but you sell at Rs 699 after a 30% discount, your COGS percentage jumps from 20% to 28.6%.
Indian D2C packaging costs typically range from Rs 25 to Rs 80 per order depending on product category and brand positioning. Premium unboxing experiences (custom boxes, tissue paper, thank-you cards) can push this to Rs 100-150. Include the cost of any inserts, samples, or promotional materials you add to each shipment.
This is where most Indian founders underestimate. Your blended shipping cost must account for:
The blended formula: (Forward cost x orders) + (RTO cost x RTO orders) + (Reverse cost x return orders), divided by total successful orders.
For a brand with 25% COD, 12% RTO rate, and 8% return rate, the blended shipping cost per delivered order is typically Rs 85-110.
Standard rates in India:
Blended payment cost for a brand with 30% COD and 70% prepaid: approximately 2.5-3% of AOV.
This is the cost that Indian D2C brands consistently underestimate. India has one of the highest RTO rates in ecommerce globally:
For every order that gets returned, you lose: forward shipping + return shipping + repackaging labor + potential product damage. Allocate this cost across your successful orders.
This is the big one. CAC = Total ad spend / Number of new customers acquired.
2026 Meta Ads CAC benchmarks for Indian D2C (based on industry data):
Important nuance: Separate your new customer CAC from repeat customer CAC. If 30% of your orders come from repeat customers (acquired through email/SMS, not ads), your blended CAC is lower than your new customer CAC. Track both.
CM2 per order = AOV – COGS – Packaging – Shipping (blended) – Payment fees – Return allocation – CAC
CM2 percentage = CM2 per order / AOV x 100
Based on data from brands spending Rs 5-50L/month on ads in 2025-2026:
| Category | Healthy CM2% | Average CM2% | Danger Zone |
|---|---|---|---|
| Beauty/Skincare | 15-25% | 8-12% | Below 5% |
| Fashion/Apparel | 10-18% | 3-8% | Below 0% |
| Food/Supplements | 8-15% | 2-6% | Below 0% |
| Health/Wellness | 12-20% | 5-10% | Below 3% |
| Home/Lifestyle | 15-25% | 8-15% | Below 5% |
If your CM2 is negative, you are losing money on every new customer you acquire. If it is between 0-5%, you are barely breaking even and have no margin for error. If it is above 10%, you have a sustainable business that can scale.
Your CAC stays roughly the same whether someone buys one product or three. Every rupee of AOV increase flows directly to CM2.
Tactics that work for Indian D2C:
Minimalist Skincare reportedly increased AOV from Rs 650 to Rs 950 by introducing curated “routine kits” that bundled complementary products. That Rs 300 AOV increase, at roughly similar costs, dramatically improved CM2.
Meta’s algorithm in 2026 rewards creative diversity. Brands that test 15-20 new ad creatives per week consistently achieve 20-30% lower CPAs than brands running the same 3-4 creatives for months.
The creative velocity framework:
boAt has been a masterclass in creative velocity, consistently flooding Meta with fresh creatives featuring different influencers, formats, and hooks. Their cost-per-purchase is estimated to be 30-40% lower than comparable electronics brands.
Every 1% reduction in RTO rate directly improves CM2 by Rs 15-25 per order for most Indian D2C brands.
Quick wins:
A repeat customer has near-zero CAC (you are reaching them through email, SMS, or WhatsApp, not paid ads). Every repeat order has dramatically better CM2 than a first order.
Indian D2C repeat purchase benchmarks:
If your repeat rate is below the lower end of your category’s range, you are over-spending on acquisition and under-investing in retention. A 10% improvement in repeat rate can improve overall CM2 by 20-30%.
Once you cross 1,000 orders per month, you have negotiating leverage with logistics partners. Key negotiation points:
Switching from a single logistics partner to a multi-courier aggregator like Shiprocket, Delhivery, or iThink Logistics can save Rs 10-20 per order through dynamic courier allocation.
This is the most counterintuitive lever. Many Indian D2C brands run perpetual 20-30% discounts that destroy CM2.
The math: If your MRP is Rs 999 and you sell at Rs 699 (30% off), your COGS percentage against selling price jumps from 20% to 28.6%. That 8.6% swing, on Rs 699, is Rs 60 per order straight off your CM2.
Better alternatives:

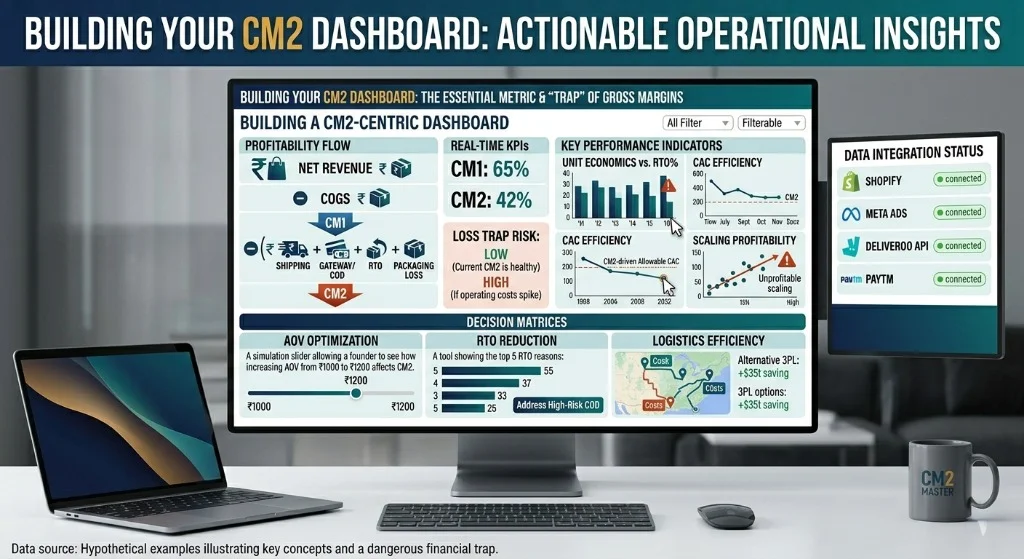
Track CM2 weekly, not monthly. Monthly data hides trends. Here is what your dashboard should show:
Want a pre-built CM2 dashboard for your brand? Download our free CM2 Calculator Template or book a free CM2 audit with Aim n Launch.
Use CM2 to make every major business decision:
Should I increase ad spend? Only if CM2 stays positive at higher spend levels. Run a 2-week test at 30% higher spend and track CM2. If CM2 drops below 5%, you have hit your efficient scaling ceiling.
Should I launch on quick commerce (Blinkit/Zepto)? Calculate CM2 for each channel separately. Quick commerce takes 30-40% commission but has zero CAC and zero shipping cost for you. Compare the CM2.
Should I offer COD? Calculate CM2 for COD orders vs prepaid orders separately. For most Indian D2C brands, COD CM2 is 40-60% lower than prepaid CM2 due to higher RTO rates and remittance fees.
Should I raise my prices? A 10% price increase with even a 15% drop in conversion rate can improve total CM2 if your current CM2 is thin. Model it out before deciding.
Mistake 1: Ignoring RTO costs. A 15% RTO rate does not just mean 15% fewer deliveries. It means you paid for shipping twice (forward + return) and might have damaged product. Factor this in.
Mistake 2: Using blended CAC when they should use new customer CAC. If 40% of your orders are repeat customers, your blended CAC looks artificially low. New customer CM2 is what determines if your growth engine is sustainable.
Mistake 3: Calculating CM2 on MRP instead of actual selling price. If you discount 25% off MRP, your CM2 calculation must use the discounted price as revenue.
Mistake 4: Not tracking CM2 by channel. Meta, Google, organic, email, marketplace all have different CM2 profiles. Knowing this lets you allocate budget to the most profitable channels.
A healthy CM2 is 10-15% of AOV for most Indian D2C categories. Above 15% is excellent. Below 5% means you need to optimize urgently. Negative CM2 means you are losing money on every customer acquired through paid channels.
Gross margin only accounts for COGS (cost of goods sold). CM2 includes all variable costs: COGS, packaging, shipping, payment fees, returns, AND customer acquisition cost. CM2 gives you the true profitability per order.
Both. CM2 per order (in rupees) tells you the absolute profit. CM2 percentage tells you how efficiently you are converting revenue to profit. Track both on a weekly basis.
Weekly at minimum. During festive seasons (Diwali, New Year) or heavy sale periods, calculate daily because CPMs spike and CAC changes rapidly.
Only if you have exceptionally high repeat purchase rates (50%+) and strong customer lifetime value. Some brands accept negative CM2 on first orders because they make it back on repeat purchases within 60-90 days. But this is a risky strategy that requires strong retention infrastructure.
One of the key to ecommerce success is speed. Customers are demanding better delivery services, including same-day delivery.
Those brands that invest in logistics and fulfillment technologies have a competitive advantage.
Trends to watch:
Right delivery timelines and updates create confidence and enhance customer satisfaction.
Your D2C brand’s profitability is hiding in the details of your unit economics. If you are spending Rs 5L+ per month on ads and are not tracking CM2, you are making decisions in the dark.
Get a free CM2 analysis for your brand. Book a 15-minute call with Aim n Launch.