There’s a number your media buyer sends you every Monday morning. It looks great. And it might be quietly destroying your business.
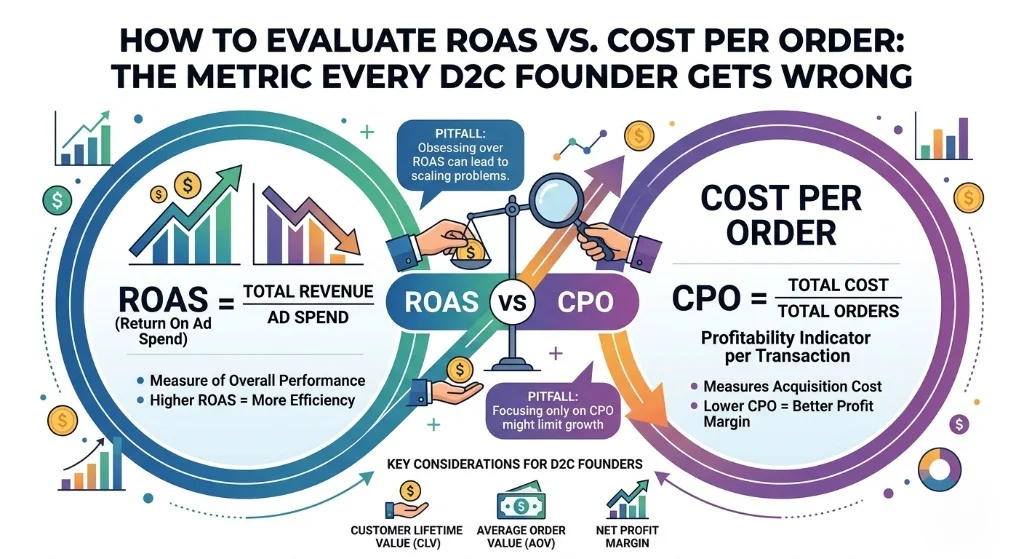
That number is ROAS — Return on Ad Spend. And while it’s not a useless metric, the way most D2C founders use it is one of the most expensive mistakes in Indian eCommerce today.
This isn’t a semantic argument. It’s a profitability argument. Let’s get into it.
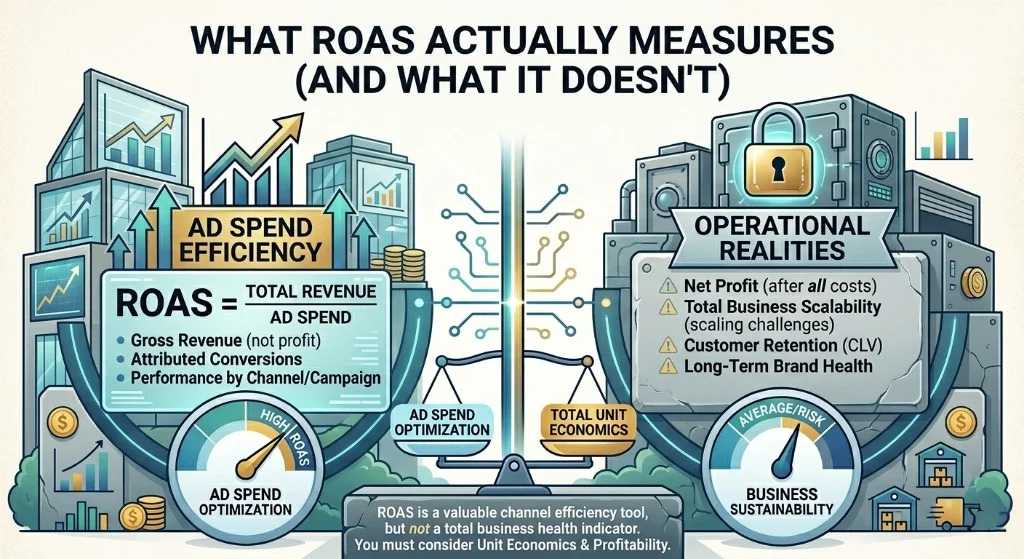
ROAS tells you one thing: for every rupee you spent on ads, how many rupees of revenue came back. A ROAS of 4X means ₹1 of ad spend generated ₹4 of revenue.
Sounds like a good thing. But here’s what ROAS does not tell you:
A brand selling a ₹999 product with a 35% gross margin and ₹120 in shipping costs needs a very different ROAS threshold than a brand selling a ₹3,500 product with a 65% gross margin and free shipping above ₹999. And yet both founders will proudly tell you they’re targeting “4X ROAS” — as if that number means the same thing.
It doesn’t.
Cost Per Order — sometimes called Cost Per Acquisition or CPA — tells you something immediately actionable: how much did you pay, in ad spend, to acquire one order?
Compare these two scenarios:
| Metric | Brand A | Brand B |
|---|---|---|
| Ad Spend | ₹1,00,000 | ₹1,00,000 |
| Revenue Generated | ₹4,00,000 | ₹3,00,000 |
| ROAS | 4X | 3X |
| Number of Orders | 100 | 300 |
| Cost Per Order | ₹1,000 | ₹333 |
| Average Order Value | ₹4,000 | ₹1,000 |
| Gross Margin | 30% | 55% |
| Gross Profit Per Order | ₹1,200 | ₹550 |
| Profit After Ad Cost | ₹200/order | ₹217/order |
Brand A has a 4X ROAS and is barely profitable. Brand B has a 3X ROAS and is more profitable per order. If you’re optimising for ROAS alone, you’d declare Brand A the winner. If you’re running a real business, Brand B is doing better.
The most sophisticated D2C brands don’t manage to ROAS or even to raw CPO. They manage to Contribution Margin per Order — the amount left over after deducting all variable costs (COGS, shipping, payment fees, returns, and ad spend) from revenue.
Here’s the simplified formula:
Contribution Margin = Revenue – COGS – Shipping – Payment Fees – Returns – Ad Spend
If your contribution margin is positive, you’re covering your fixed costs and working toward profit. If it’s negative, you’re losing money on every order — no matter what your ROAS slide looks like.
Once you know your target contribution margin per order, you can work backwards to your Maximum Allowable CPO — the ceiling above which every order is a loss. This is the number you hand your media buyer, not a ROAS target.
To be precise: ROAS is not a useless metric. It’s a useful input in a larger framework. Here’s where it legitimately helps:
Comparing channel efficiency. If Meta ROAS is 3.5X and Google ROAS is 5.2X, that’s a signal worth investigating — as long as you’re comparing equivalent margin profiles.
Monitoring account health over time. A sudden drop in ROAS on a stable campaign is a red flag for creative fatigue, audience overlap, or a landing page issue.
Communicating with stakeholders. Investors and operators understand ROAS. It’s a quick shorthand for “are the ads working in the most basic sense.”
The problem isn’t ROAS itself. The problem is using ROAS as a proxy for profitability — which it is not.
If you want a simple, practical framework for evaluating the health of your performance marketing, track these three numbers weekly:
These three numbers, tracked consistently, will tell you more about your business than a ROAS dashboard ever will.
One more trap worth mentioning: most founders look at campaign-level ROAS without looking at their blended MER (Marketing Efficiency Ratio) — total revenue divided by total marketing spend across all channels.
It’s entirely possible to have a 5X campaign ROAS while your MER is 1.8X — meaning that at the brand level, you’re spending ₹1 in marketing for every ₹1.80 of revenue, with a 40% margin. Do the math on that and you’ll understand why so many high-ROAS D2C brands are quietly losing money.
ROAS is a metric your ad platform invented to make your ads look good. Cost Per Order is a metric your accountant actually cares about. Contribution Margin is the metric your business runs on.
The D2C founders who build sustainable, profitable brands are the ones who stop celebrating ROAS screenshots and start managing their numbers with the same rigour that a CFO would bring to a P&L. It’s not glamorous. But it’s the difference between a brand that grows and a brand that just spends.
Aim n Launch helps Indian D2C brands track what actually matters — orders, cost per order, and payback — not vanity metrics. If you’d like a free growth audit, book a call here.