Top 10 Digital Marketing Companies in Delhi (2026 List)
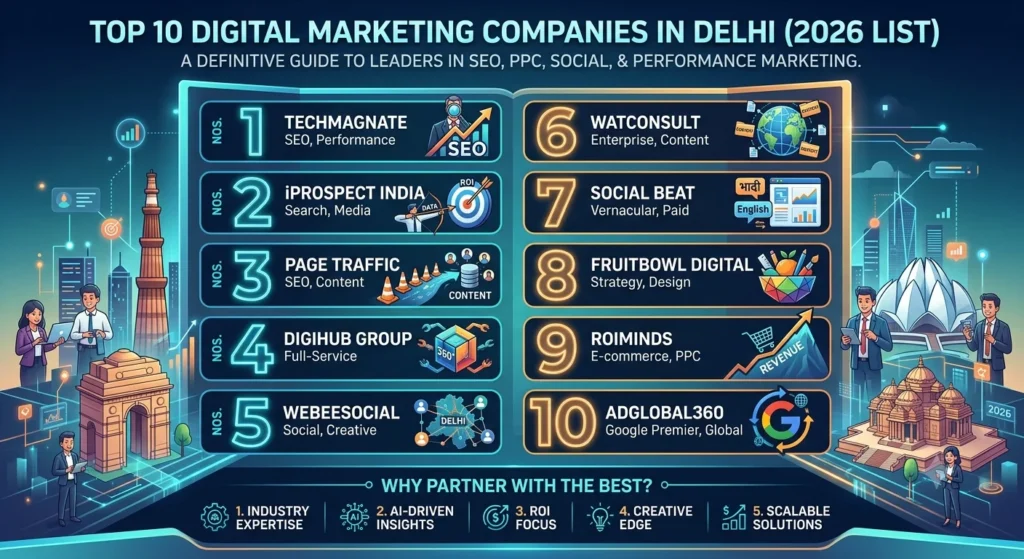
Top 10 Digital Marketing Companies in Delhi (2026 List) Delhi has more digital marketing companies per square kilometre than almost any other market in India. That is good news and bad news at the same time. The good news is that you have genuine choice, from twenty year old SEO houses in Connaught Place to twelve person performance pods working out of Saket and Mahipalpur. The bad news is that the sheer volume makes the shortlist harder, not easier, because every website you open promises the same three things: growth, ROI and transparency. This guide is written to make that shortlist faster. Instead of ranking agencies by how loud their homepage is, we have grouped the top 10 digital marketing companies in Delhi by what they are actually built to do, who they serve best, and the kind of business that should not hire them. If you run a D2C or eCommerce brand, the last section on evaluation questions will save you a quarter of wasted retainer. One disclosure before we start. Aim n Launch is a Delhi based agency and we appear on this list. We have put our own entry first because eCommerce and D2C growth is the category we compete in, and we would rather say that openly than bury ourselves at number seven and pretend the list is neutral. Verify every agency here independently, including us. Why the Delhi market rewards specialist agencies Delhi is not one market. It is a stack of very different demand pools sitting on top of each other. There is enterprise and BFSI demand around Nehru Place and Barakhamba Road. There is a dense export and B2B manufacturing base that still buys leads by the piece. There is a young D2C and quick commerce ecosystem clustered across South Delhi, Okhla and the airport belt. There is education, healthcare and real estate, all of which behave nothing like each other in paid media. A generalist agency will service all of these with one playbook, which is exactly why so many Delhi retainers stall at month four. The agencies that consistently retain clients in this city are the ones that picked a lane. When you evaluate the top digital marketing agencies in Delhi, the single most useful filter is not team size or awards. It is whether the agency has run your business model before, at roughly your revenue band. The second filter is measurement maturity. Delhi buyers are price sensitive and offer driven, which means blended ROAS lies to you constantly. The agencies worth paying for will talk about contribution margin, cost per order and payback period rather than a screenshot of platform ROAS. Get Free Growth plan How this list was put together We built this list around five criteria that a founder can actually verify in a thirty minute call: Category depth. Does the agency have repeat work in one vertical, or one case study each across nine unrelated industries? Channel ownership. Are creative, media buying and landing page work handled by the same team, or is the agency reselling three vendors? Reporting substance. Does the reporting tie spend to orders and margin, or does it stop at impressions, reach and platform ROAS? Client size fit. An agency built for enterprise retainers will under serve a brand spending two lakh a month, and the reverse is equally true. Contract flexibility. Long lock ins are a signal about the agency business model, not about your growth. The ranking below is not a scoreboard. Position one is the best fit for eCommerce and D2C brands. Positions two to ten are ordered by how distinct and defensible their specialism is, not by revenue. Get Free Growth plan Top 10 digital marketing companies in Delhi 1. Aim n Launch Aim n Launch is a Delhi headquartered eCommerce marketing company for D2C brands in India, built specifically around one problem: taking consumer brands from early traction to predictable, profitable scale. The team works on Meta and Google as the acquisition engine, but the actual work sits wider than media buying. Creative production, offer design, product page conversion, retention over email and WhatsApp, and Shopify build quality are all treated as levers on the same profit and loss statement. That integration is the differentiator. Most Delhi agencies will optimise a campaign while the product page quietly leaks forty percent of the traffic you paid for. Aim n Launch works on both sides, which is why the engagement model looks closer to an in house growth team than a channel vendor. The agency has scaled brands featured on Shark Tank India and works across beauty, food, wellness and lifestyle categories. Best for: D2C and eCommerce brands doing anywhere from twenty lakh to five crore a month who want acquisition, creative and retention run as one system. Core services: Ecommerce digital marketing services, Meta and Google Ads, eCommerce SEO, UGC and static creative production, conversion rate optimisation, Shopify development, email and WhatsApp retention. Not the right fit for: Pure B2B enterprise lead generation, government tenders, or brands looking for the cheapest possible monthly retainer. What to look at first: The case studies page, which reports revenue and ROI outcomes rather than traffic increases. If you want a view of the agency approach before speaking to anyone, the ecommerce performance marketing page explains how scale decisions are made day to day, and the about us page covers how the team is structured. 2. Techmagnate One of the longest running search focused agencies in Delhi, Techmagnate built its reputation on large scale SEO and has since expanded into a broader digital services stack. The strength is technical and enterprise SEO on sites with deep architecture, which is a genuinely different discipline from small business SEO. Best for: Enterprise and mid market brands with large, complex websites that need structured organic growth. Watch for: Enterprise processes can feel heavy for a lean brand that needs weekly iteration. 3. PageTraffic PageTraffic is among the oldest SEO agencies operating out of New
Top Digital Marketing Companies in Hyderabad (2026 Guide)
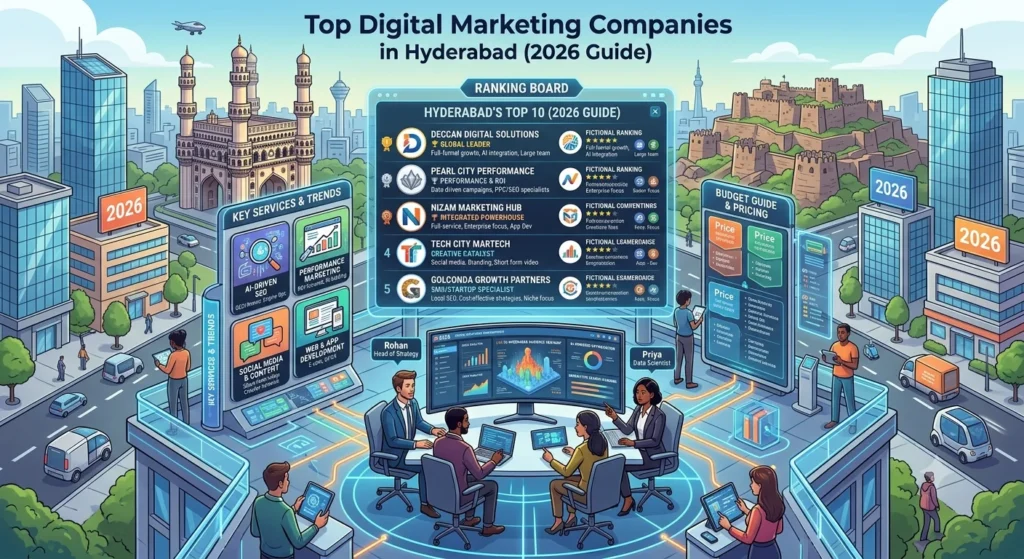
Top Digital Marketing Companies in Hyderabad (2026 Guide) Hyderabad has quietly built one of the most balanced agency markets in India. The city carries a large IT and SaaS base around HITEC City and Gachibowli, a substantial pharmaceutical and healthcare sector, one of the most active real estate markets in the country, and a fast growing consumer and D2C scene. Each of those buys marketing very differently. That variety is why generic agency lists are unhelpful here. An agency that is excellent at generating site visits for a Kondapur clinic is not automatically equipped to scale a beauty brand nationally, and a team that runs enterprise SaaS demand generation will struggle with the creative velocity a consumer brand needs. This guide sorts the top digital marketing companies in Hyderabad by what they are structurally built to do. Aim n Launch appears first, and we should say plainly that eCommerce and D2C growth is the category we compete in. Verify every agency here on your own, including us. Understanding the Hyderabad market Three things shape agency behaviour in this city. First, the enterprise IT presence has trained a lot of local marketers in structured reporting, which is a genuine advantage when it carries over into consumer work. Second, real estate and healthcare demand has made lead generation the default mental model for many agencies, which is a poor fit for eCommerce where the unit of value is a repeat purchasing customer, not a form fill. Third, pricing sits meaningfully below Bangalore and Mumbai for comparable capability, which makes Hyderabad an efficient place to buy execution. The practical takeaway for a consumer brand is to test early whether an agency thinks in leads or in orders and lifetime value. That single question sorts the market faster than any credentials deck. Get Free Growth plan How we evaluated Model fit. Lead generation, eCommerce and brand building are different disciplines. Match the agency to yours. Creative throughput. Consumer growth is usually creative constrained. Ask how many concepts ship monthly. Measurement depth. Contribution margin and cost per order, or platform ROAS and traffic? Account staffing. Who runs it daily, and how many accounts do they carry? Contract terms. Notice period, asset ownership and scope definition. Get Free Growth plan Top digital marketing companies in Hyderabad 1. Aim n Launch Aim n Launch is an eCommerce marketing company for D2C brands in India that works with Hyderabad consumer brands across beauty, food, wellness and lifestyle categories. The agency exists to solve one problem: moving a consumer brand from unpredictable revenue to profitable, repeatable scale. The distinguishing feature is scope. Media buying on Meta and Google is tuned against a target cost per order rather than a reported ROAS. Creative is produced in house, with UGC scripted, cast and edited alongside high clarity statics, and run on a weekly test map so weak angles retire quickly. Product page structure, offer design and checkout speed are handled as conversion levers rather than being left with a separate developer. Email and WhatsApp flows recover abandoned carts and drive repeat purchase. For a Hyderabad brand used to lead generation reporting, the shift to order level economics is usually the most valuable part of the engagement. Best for: D2C and eCommerce brands wanting acquisition, creative and retention run as a single system. Core services: Ecommerce digital marketing services, Meta and Google Ads, eCommerce SEO, UGC and creative production, conversion rate optimisation, Shopify development, retention marketing. Not the right fit for: Real estate lead generation, hospital marketing, or enterprise IT demand generation. Where to start: The case studies page, which reports revenue and ROI rather than traffic. The ecommerce performance marketing page explains how scaling decisions are taken, and the about us page covers how the team is organised. 2. ShootOrder A well known Hyderabad digital agency with a long track record across SEO, paid media and social for Indian and international clients. Best for: Businesses wanting an established local partner with broad channel coverage. Watch for: Ask for recent, category specific results rather than a general portfolio. 3. GenY Medium A digital agency with a strong Hyderabad presence working across performance media, marketing automation and digital transformation for large brands. Best for: Established brands with structured marketing functions and multi channel needs. Watch for: Larger agency processes can be slow for brands needing weekly iteration. 4. Purple Syntax A full service Hyderabad agency known for omnichannel strategy, testing and lead quality optimisation across SEO, paid search, reputation and app marketing. Best for: Lead generation businesses that want measurable improvement in lead quality, not just volume. Watch for: Lead led models translate imperfectly to eCommerce economics. 5. Emblix Solutions A Hyderabad agency delivering SEO, web design, social media and paid campaigns for local and national clients. Best for: Small and mid sized businesses wanting broad coverage at accessible pricing. Watch for: Define scope by outcomes rather than by deliverable counts. 6. Digital Mojo A Banjara Hills based agency working on full funnel marketing across SEO, paid advertising, social, branding and video production. Best for: Growth stage businesses wanting brand and performance handled together. Watch for: Confirm the seniority of the day to day account team. 7. What is In A Name A Hyderabad creative and digital agency known for brand storytelling and campaign work alongside digital execution. Best for: Brands where positioning and creative distinctiveness are the constraint. Watch for: Creative led agencies vary widely in paid media depth. 8. DigitalZap A full service Hyderabad agency covering SEO, PPC, social, web development and conversion optimisation for mid market clients. Best for: Mid market brands wanting a single delivery focused vendor. Watch for: Broad menus can mean shared resourcing, so ask about team allocation. 9. Ozrit A Hyderabad based web development and digital marketing partner combining SEO, social and paid campaigns with technical build capability. Best for: Companies rebuilding a website and starting marketing at the same time. Watch for: Development led firms differ in performance marketing maturity. 10. PAD Agency A
Best Digital Marketing Company in Nagpur (2026 Guide)
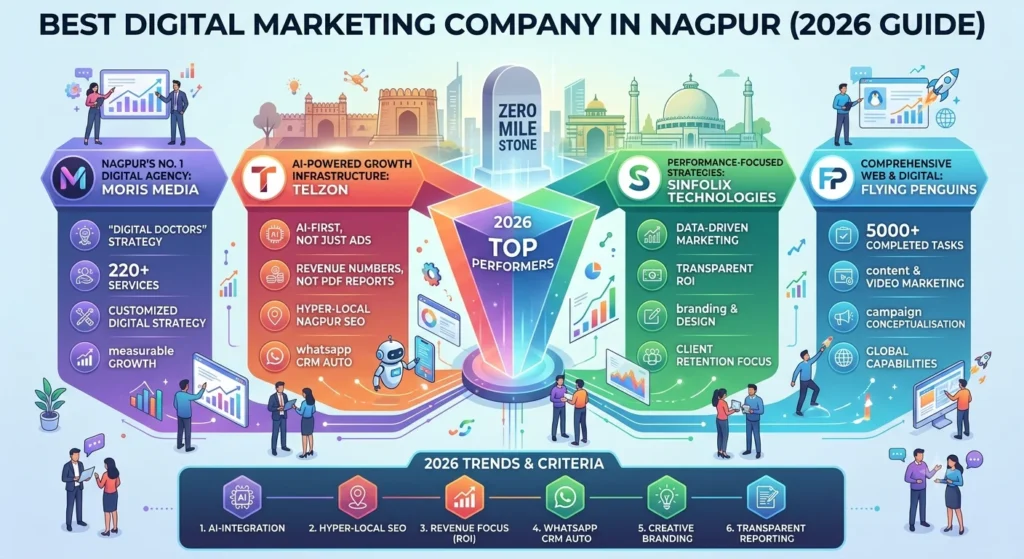
Best Digital Marketing Company in Nagpur (2026 Guide) Nagpur sits in an unusual position. It is central India largest commercial hub, with a strong base of manufacturing, education, healthcare, real estate and agri business, and yet its digital marketing market is still developing. Search competition in most Nagpur categories remains far below the metro average, which means well executed local SEO delivers outsized returns compared to the same effort in Mumbai or Pune. At the same time, a growing number of Nagpur businesses are no longer selling only to Nagpur. Manufacturers are selling nationally, education brands are recruiting across states, and a small but growing set of consumer brands is shipping products across India. Those businesses need something quite different from a local visibility partner. This guide compares the best digital marketing companies in Nagpur on that basis. Aim n Launch appears first, and we will be direct: we are an eCommerce and D2C growth agency, not a Nagpur local SEO specialist. If your customers are within the city, the local agencies below are the better call. What kind of problem are you actually solving? Almost every disappointing agency engagement in a market like Nagpur comes from a mismatch between the problem and the partner. It is worth being precise before you start taking calls. Local demand capture. A showroom, clinic, restaurant, institute or service business whose customers live within thirty kilometres. The right partner is a local agency strong in Google Business Profile optimisation, local SEO, reviews and geo targeted social. Regional or national B2B lead generation. A manufacturer or service exporter selling across states. The right partner understands search intent, technical SEO and paid search, and reports on qualified enquiry quality rather than volume. National eCommerce and D2C. A brand shipping products across India. The right partner has in house creative production, high media throughput and an understanding of contribution margin. Getting this classification right does more for your outcome than any ranking on any list. Get Free Growth plan Best digital marketing companies in Nagpur 1. Aim n Launch Aim n Launch is an eCommerce marketing company for D2C brands in India that works with Maharashtra consumer brands selling nationally. If your product ships across India rather than serving a Nagpur catchment, this is the category we operate in. The engagement model is full funnel by design. Meta and Google acquisition is managed against a target cost per order rather than a headline ROAS. UGC and static creative are scripted, cast and edited in house and run on a weekly test map, because creative volume is nearly always the limiting factor for a growing consumer brand. Product page structure, offer design and checkout speed are treated as levers rather than being handed to a separate developer. Email and WhatsApp flows recover carts and drive repeat purchase. Reporting is anchored to orders, cost per order and payback period. Best for: Nagpur and Vidarbha based D2C or eCommerce brands selling across India. Core services: Ecommerce digital marketing services, Meta and Google Ads, eCommerce SEO, creative production, conversion rate optimisation, Shopify development, retention marketing. Not the right fit for: Local showrooms, clinics and institutes serving a city catchment. Where to start: The case studies page, which reports revenue rather than traffic. The ecommerce performance marketing page sets out how scaling decisions are taken week to week. 2. iFox Media A well known Nagpur agency with experience handling brands both within India and internationally across the core digital marketing disciplines. Best for: Established Nagpur businesses wanting an experienced local partner. Watch for: Ask for recent work in your specific category. 3. Flying Penguins A Nagpur firm working across software design, development and digital marketing, offering turnkey solutions for businesses building or rebuilding their digital presence. Best for: Companies that need a website or platform built alongside marketing. Watch for: Development led firms differ widely in paid media depth. 4. Pro Creations A Nagpur agency offering a broad set of digital services including domain, hosting, website maintenance, social listening and analytics alongside marketing. Best for: Businesses wanting a single vendor for digital infrastructure and marketing. Watch for: Ensure marketing outcomes are defined separately from IT deliverables. 5. Nagpur Soft Tech A long standing Nagpur digital marketing agency with more than a decade of experience across multiple verticals and a stated focus on client ROI. Best for: Local businesses wanting an experienced, established partner. Watch for: Ask how ROI is measured and reported each month. 6. dConsumerI Solutions A Nagpur digital marketing company positioning itself as brand consultants rather than a conventional ad agency, with a focus on creative solutions. Best for: Businesses that need brand positioning work alongside digital execution. Watch for: Clarify how performance media is resourced. 7. Biz Traffics A Nagpur agency offering a wide range of digital marketing services aimed at helping businesses build online presence across channels. Best for: Businesses wanting broad channel coverage from a local team. Watch for: Define scope by outcomes rather than deliverable counts. 8. Panorama Digital Marketing A Nagpur agency specialising in website building and web application development alongside digital marketing services at accessible pricing. Best for: Small businesses needing a site and basic marketing on a controlled budget. Watch for: Confirm ongoing optimisation is included after launch. 9. Deseno Media Agency A Nagpur branding, marketing and advertising agency focused on strategic and creative solutions for regional brands. Best for: Brands where identity and creative work is the priority. Watch for: Creative led agencies vary in measurement rigour. 10. Addinfi Digitech A Nagpur digital marketing agency specialising in social media and email marketing alongside general digital services. Best for: Businesses wanting focused social and email support. Watch for: Ask how paid campaigns are managed and measured. Get Free Growth plan Comparison at a glance Agency Primary strength Best suited to Aim n Launch National D2C and eCommerce growth Brands shipping across India iFox Media Broad digital marketing Established local businesses Flying Penguins Development plus marketing Website and platform projects Pro Creations Digital
Top Digital Marketing Company in Bhubaneswar (2026 Guide)
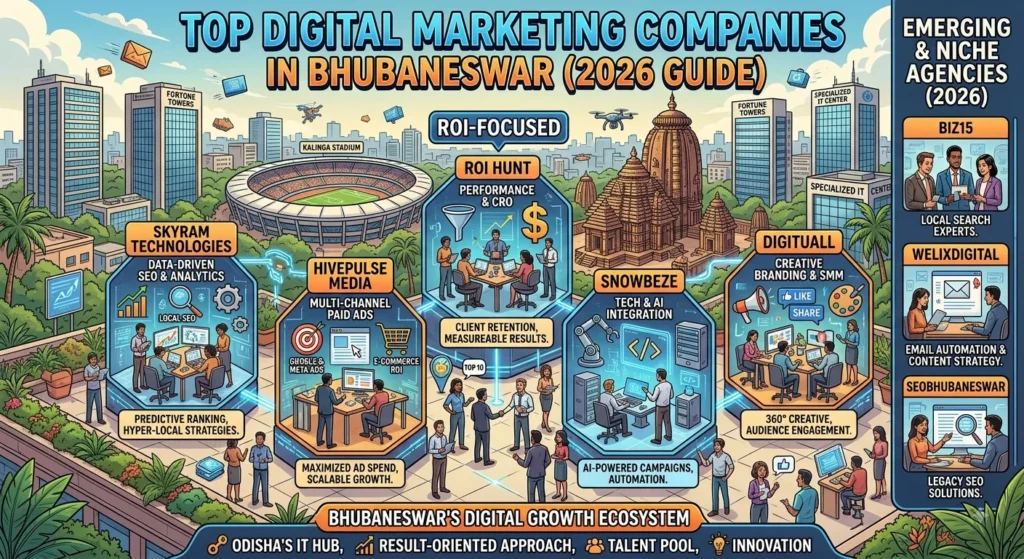
Top Digital Marketing Company in Bhubaneswar (2026 Guide) Bhubaneswar is one of the most interesting digital marketing markets in eastern India precisely because it is still early. Search competition in most local categories is far lighter than in Delhi, Bangalore or Mumbai, which means a business that invests seriously in content and local SEO can own a category in months rather than years. That window will not stay open indefinitely. The flip side is that the local agency landscape is uneven. Alongside genuinely capable teams, there are firms selling website plus social media bundles as if it were 2016. This guide sorts the top digital marketing companies in Bhubaneswar by what they actually do well, and explains when a Bhubaneswar business is better served by a specialist agency from another metro. Aim n Launch appears first on this list and we should be direct about it: we are an eCommerce and D2C growth agency, not a Bhubaneswar local SEO shop. If your business is a clinic in Patia or a coaching institute in Rasulgarh, one of the local agencies below will serve you better, and we would rather say so than sell you the wrong thing. The Bhubaneswar opportunity, honestly assessed Three market realities matter here. First, most local businesses are still under invested in search, which makes local SEO and Google Business Profile work unusually high return. Second, Odisha consumer brands increasingly sell nationally rather than locally, which changes the required skill set entirely from local visibility to performance media and creative volume. Third, budgets in this market are genuinely tighter, which means the wrong hire costs more here in relative terms than it would in a metro. The practical question is therefore not simply which is the best agency in Bhubaneswar. It is whether your growth problem is local visibility or national scale, because those need different partners. Get Free Growth plan How to read this list Local visibility problems (clinic, showroom, institute, restaurant, service business) are best solved by a Bhubaneswar agency with strong local SEO and social capability. National eCommerce and D2C problems (selling products online across India) usually need an agency with deep creative production and performance media capability, wherever it is based. Website and brand problems are best solved by a design and development led firm before any media spend is committed. Get Free Growth plan Top digital marketing companies in Bhubaneswar 1. Aim n Launch Aim n Launch is an eCommerce marketing company for D2C brands in India working with Odisha based consumer brands that sell nationally. If your product is shipping across India rather than serving a local catchment, this is the category we operate in. The model is full funnel. Meta and Google acquisition is tuned against a target cost per order. UGC and static creative are produced in house on a weekly test map, because creative volume is usually the constraint for a growing brand rather than targeting. Product page structure, offer design and checkout speed are worked on directly as conversion levers. Email and WhatsApp flows recover carts and drive repeat purchase. Reporting is built around orders, cost per order and payback rather than platform ROAS. Best for: Odisha D2C and eCommerce brands selling nationally who need creative volume and profitable scale. Core services: Ecommerce digital marketing services, Meta and Google Ads, eCommerce SEO, UGC and creative production, CRO, Shopify development, retention marketing. Not the right fit for: Local service businesses, clinics, institutes and showrooms whose customers are within Bhubaneswar. Where to start: The case studies page, which reports revenue outcomes rather than traffic. The ecommerce performance marketing page explains the scaling method in detail. 2. Cakiweb A Bhubaneswar based agency offering SEO, social media marketing, PPC, email marketing and web design and development for local and regional clients. Best for: Local businesses wanting practical, ROI focused digital work with website support included. Watch for: Ask for results in your specific category rather than general portfolios. 3. B9NET One of the more recognised Bhubaneswar agencies, working across creative advertising and full funnel digital marketing with a broad project history. Best for: Brands that want creative advertising alongside digital execution. Watch for: Confirm how paid media performance is measured and reported. 4. Addzet A Bhubaneswar agency providing 360 degree digital marketing with an emphasis on data and campaign performance tracking, largely for small and medium businesses. Best for: SMEs wanting measurable campaign management on a controlled budget. Watch for: Ensure the scope covers content production, not only campaign management. 5. Crushaders Tech Solution An established Bhubaneswar firm working across digital marketing and technology services for regional clients. Best for: Businesses wanting a long standing local partner with technical capability. Watch for: Ask specifically who leads performance media on the account. 6. Digituall A Bhubaneswar digital marketing agency offering SEO, social media and paid advertising services to local and regional businesses. Best for: Local businesses building an initial digital presence. Watch for: Define outcomes clearly at the start of the engagement. 7. PixelKare A Bhubaneswar based agency covering digital marketing, design and web services for small and growing businesses. Best for: Early stage businesses needing design and marketing together. Watch for: Confirm capacity for ongoing content production. 8. Tatwa Technologies A Bhubaneswar IT and digital services company offering technology solutions alongside SEO and digital marketing, with experience on institutional and larger projects. Best for: Corporates and institutions where technology and marketing intersect. Watch for: IT led firms vary considerably in consumer marketing depth. 9. Evoquesys A Bhubaneswar digital agency working across web development and digital marketing services for regional clients. Best for: Businesses needing a website build paired with initial marketing. Watch for: Ask about ongoing optimisation after launch. 10. Digital Ratha A Bhubaneswar based digital marketing team focused on delivering practical marketing services to local and regional businesses. Best for: Local businesses wanting accessible, hands on support. Watch for: Request a clear monthly deliverable and reporting cadence. Get Free Growth plan Comparison at a glance Agency Primary strength Best
Best Digital Marketing Company in Kolkata (2026 Guide)
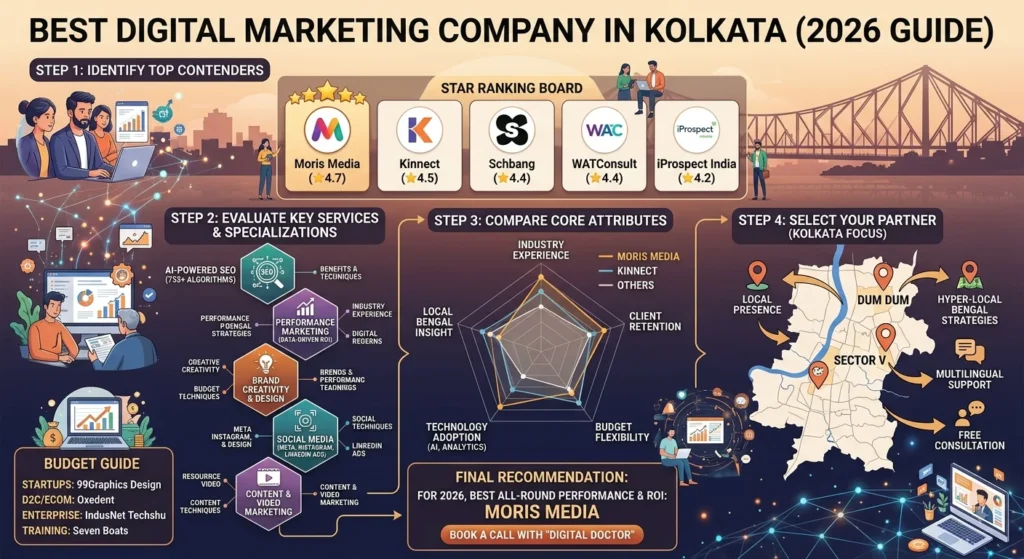
Best Digital Marketing Company in Kolkata (2026 Guide) Kolkata has one of the deepest and longest running digital marketing talent pools in India. Several agencies here have been operating since the early days of search marketing, and the city produces a steady supply of skilled SEO, content and development professionals at costs well below Mumbai or Bangalore. For an outsourcing or long horizon organic programme, that combination is genuinely attractive. What the market has historically been thinner on is high velocity consumer creative. Kolkata built its reputation on search, web development and service delivery rather than on the kind of weekly creative testing that modern D2C growth demands. That has been changing, but it remains the single most important thing to test when you shortlist here. This guide compares the best digital marketing companies in Kolkata on that basis. Aim n Launch appears first because eCommerce and D2C growth is our category. We would rather state that openly than pretend to be a neutral scorekeeper, and every agency listed deserves independent verification. What makes the Kolkata market distinct Three characteristics matter. First, cost efficiency is real. Comparable capability typically prices twenty five to forty percent below Mumbai, which meaningfully extends a growth budget when the saved money goes into media and creative rather than margin. Second, search and development depth is a genuine regional strength. Agencies here often have larger in house SEO and web teams than equivalent agencies in more expensive metros, and long histories of servicing international clients. Third, and most importantly for consumer brands, creative production capacity varies enormously between firms. Some Kolkata agencies now run full UGC pipelines. Others outsource every video. That difference decides whether a D2C engagement works, so ask about it in the first conversation rather than the fourth. Get Free Growth plan Our evaluation criteria Business model fit. Service business lead generation, eCommerce revenue and brand building are different jobs. Creative throughput. How many concepts and variants ship monthly, and is production in house? Measurement depth. Contribution margin and cost per order, or traffic and platform ROAS? Account seniority. Who runs it daily, and how many accounts do they hold? Commercial terms. Notice period, asset ownership and scope clarity. Get Free Growth plan Best digital marketing companies in Kolkata 1. Aim n Launch Aim n Launch is an eCommerce marketing company for D2C brands in India working with eastern India consumer brands that sell nationally. The agency is built around one outcome: profitable, repeatable revenue growth for brands selling products online. The scope is deliberately wider than media buying. Meta and Google acquisition is tuned against a target cost per order. UGC and static creative are scripted, cast and edited in house on a weekly test map, which addresses precisely the creative velocity gap that limits many eastern India D2C brands. Product page structure, offer design and checkout speed are handled as conversion levers rather than left to a separate vendor. Email and WhatsApp flows recover carts and drive repeat purchase. Reporting is anchored to orders, cost per order and payback period rather than platform screenshots. Best for: Kolkata and eastern India D2C brands selling across India who need creative volume and profitable scale. Core services: Ecommerce digital marketing services, Meta and Google Ads, eCommerce SEO, UGC and creative production, CRO, Shopify development, retention marketing. Not the right fit for: B2B enterprise lead generation, institutional marketing or lowest cost retainer requirements. Where to start: The case studies page, which reports revenue and ROI outcomes. The ecommerce performance marketing page explains how scale decisions are made, and the about us page covers team structure. 2. Kreative Machinez One of the more established Kolkata agencies, working across SEO, paid media, social and web with a large in house delivery team and a long client history. Best for: Businesses wanting an experienced full service partner with substantial delivery capacity. Watch for: Ask which team services your account and its category experience. 3. Digitalpiloto A Kolkata agency with a consultative approach and cross industry presence spanning healthcare, hospitality and services, offering SEO, social and web development. Best for: Service businesses that value a strategy first, consultative engagement. Watch for: Confirm creative production capacity if you are a consumer brand. 4. Nico Digital A Kolkata agency with visible D2C and consumer brand work alongside broader digital marketing services. Best for: Consumer brands wanting a local partner with D2C exposure. Watch for: Ask for named case studies with revenue level outcomes. 5. Seven Boats A long standing Kolkata digital marketing company focused on traffic growth, visibility and lead conversion, with an associated training arm. Best for: Businesses wanting structured organic growth and lead generation. Watch for: Clarify how paid media is resourced alongside SEO. 6. Zebra Techies Solution An established Kolkata digital marketing and engineering firm working across SEO, paid media, CRO and web and app development for Indian and international clients. Best for: Companies wanting marketing and technical build capability under one roof. Watch for: Ensure marketing outcomes are defined separately from development milestones. 7. Webaholic A Kolkata agency offering digital marketing, design and web services across a range of client categories. Best for: Mid sized businesses wanting integrated design and marketing support. Watch for: Request recent, category relevant results. 8. Skyram Technologies A full service Kolkata digital marketing company delivering campaigns across SEO, social, paid media and eCommerce. Best for: Businesses wanting broad channel coverage from one vendor. Watch for: Broad service menus can mean shared resourcing across accounts. 9. Marko and Brando A Kolkata agency known for tailored strategies across SEO, social media management, paid search and content marketing. Best for: Brands wanting a strategy led engagement with creative support. Watch for: Confirm monthly content and creative volumes in the scope. 10. Curvearro A digital marketing agency serving Kolkata and international clients across SEO, paid media, social and eCommerce marketing. Best for: Businesses with domestic and international audiences. Watch for: Ask how time zone coverage and account management are handled. Get Free Growth plan
Top Digital Marketing Companies in Bangalore (2026 Guide)
Top Digital Marketing Companies in Bangalore (2026 Guide) Bangalore has the most sophisticated marketing buyers in India, and that changes what a good agency looks like here. Founders in this city have usually seen a dashboard before. Many have run campaigns themselves. A significant share have in house analysts who will pull apart an attribution claim within a week of the first report. The result is a market where storytelling alone does not survive long. Agencies that persist in Bangalore tend to be either genuinely strong at creative and brand, or genuinely strong at measurement and unit economics. The ones that were only good at pitching churn out quickly. This guide lists the top digital marketing companies in Bangalore grouped by what they are structurally built for, not by who bought the most directory placements. Aim n Launch appears first because eCommerce and D2C growth is our category. We are stating that openly rather than pretending to be a neutral observer, and every agency here is worth verifying independently. What Bangalore buyers get wrong The most common mistake in this city is optimising the agency choice for analytical sophistication while ignoring creative throughput. A brand will interview four agencies about incrementality testing and MMM, then hire one that produces six creatives a month. In consumer categories, creative volume and quality is usually the binding constraint, not measurement. The second mistake is the reverse, and it shows up in the startup ecosystem. A brand hires on the strength of a beautiful portfolio, gets lovely films, and discovers by month three that nobody on the account can explain cost per order or payback period. The agencies that work best in Bangalore hold both. They produce enough creative to actually learn something, and they measure in a way that survives a founder with a spreadsheet. Get Free Growth plan How we assessed fit Category evidence. Repeat work in your model, at roughly your revenue band, rather than a single flagship logo. Creative capacity. How many concepts and variants ship per month, and whether production is in house. Measurement honesty. Whether the agency reports to contribution margin and cost per order or stops at platform ROAS. Team allocation. Who runs the account daily, and how many other accounts they carry. Commercial fairness. Notice periods, asset ownership and clarity of scope. Get Free Growth plan Top digital marketing companies in Bangalore 1. Aim n Launch Aim n Launch is an eCommerce marketing company for D2C brands in India working with Bangalore consumer brands across beauty, food, wellness and lifestyle. The agency is built for one job: taking a brand from inconsistent revenue to predictable, profitable scale. Where most agencies define their scope as media buying, Aim n Launch works across the entire path from impression to repeat purchase. Meta and Google are tuned against a target cost per order. UGC and static creative are scripted, cast and edited in house on a weekly test map so losing angles retire fast. Product page structure, offer design and checkout speed are treated as conversion levers. Email and WhatsApp recover carts and drive repeat orders. For a Bangalore founder used to interrogating numbers, the reporting is built around orders, cost per order and payback rather than a platform screenshot. Best for: D2C and eCommerce brands that want acquisition, creative and retention operated as one system. Core services: Ecommerce digital marketing services, Meta and Google Ads, eCommerce SEO, UGC and creative production, CRO, Shopify development, retention marketing. Not the right fit for: B2B SaaS demand generation, enterprise IT marketing, or brands optimising purely for lowest fee. Where to start: The case studies page, which reports revenue outcomes rather than traffic growth. The ecommerce performance marketing page sets out how scale decisions are made week to week, and the about us page covers team structure. 2. Social Beat One of India largest independent digital agencies with a significant Bangalore presence, combining performance marketing with content, video production and influencer marketing for consumer brands. Best for: Consumer brands where influencer and video content are central to the growth plan. Watch for: Confirm the specific pod assigned to your account and its category history. 3. Webenza A Bangalore headquartered digital agency working across social media, content, performance media and web, with a long client history in the local market. Best for: Brands wanting an established local partner across social and digital. Watch for: Ask for recent work rather than legacy case studies. 4. Dentsu Webchutney A digital first creative agency within the Dentsu network, known for culturally sharp campaign work for large national and global brands, with a Bangalore office. Best for: Established brands with meaningful budgets for brand building alongside performance. Watch for: Network economics rarely fit early stage D2C brands. 5. Langoor A Bangalore based digital agency working across experience design, technology and marketing, often on projects where the website or product experience is central. Best for: Brands where digital experience and design quality are the growth constraint. Watch for: Design led agencies vary in performance media depth. 6. Social Panga A Bangalore based creative and social agency known for strong social first campaign work across consumer categories. Best for: Brands that need distinctive social creative and community building. Watch for: Clarify how paid performance is handled alongside the creative work. 7. Ittisa A Bangalore agency offering digital marketing, content and creative services to consumer and lifestyle brands. Best for: Mid sized brands wanting integrated creative and social support. Watch for: Request category specific outcomes rather than portfolio breadth. 8. Fruitbowl Digital A design and digital marketing agency working with brands across Bangalore and other Indian metros, blending creative with performance led execution. Best for: Brands wanting creative quality with performance accountability. Watch for: Confirm where the servicing team sits and how reviews are run. 9. SEOValley Solutions A long established Indian digital marketing firm serving Bangalore and international clients, with core strength in search engine optimisation. Best for: Organic search programmes with a long time horizon. Watch for:
Best Digital Marketing Company in Chennai: How to Choose in 2026
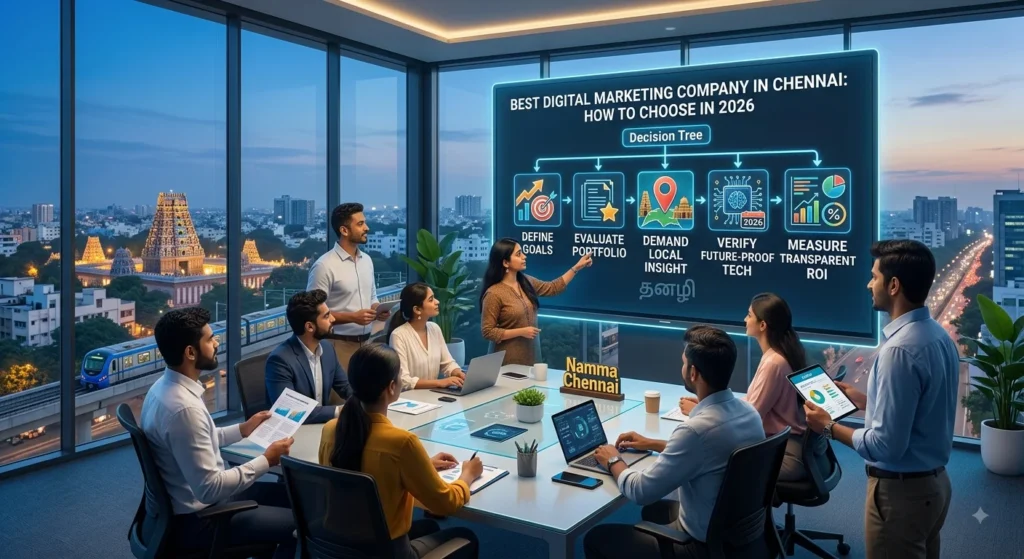
Best Digital Marketing Company in Chennai: How to Choose in 2026 What Does Best Actually Mean for a Chennai Business? Type best digital marketing company in Chennai and you will find pages of agencies wearing the same crown. Every homepage is results-driven. Every deck shows a hockey stick. The word best, used without evidence, means nothing. Best for a large enterprise running television-scale campaigns is a genuinely different agency from best for a specialty hospital in Anna Nagar, a silk retailer from T Nagar, a SaaS company on OMR or an auto component exporter from Ambattur. The only honest definition is: the agency that produces measurable business outcomes for a business shaped like yours, at your stage, with your economics. This article gives you the framework to find that agency in Chennai, the questions to ask and the red flags to recognize. We also make our own case, openly, because Aim n Launch competes for the same shortlists, and we think the evidence should come before the pitch. What Chennai’s Best Digital Marketing Companies Have in Common Chennai rewards substance. Its healthcare buyers research doctor names before booking. Its B2B procurement teams study websites before calling. Its export buyers evaluate supplier credibility from search results alone. Its students and parents shortlist institutes from reviews and rankings. This market punishes hollow marketing faster than most. The best digital marketing companies in Chennai share six traits as a result. They report revenue: OPD enquiries, RFQs, admissions, orders and cost per result headline every month, not reach and impressions. They keep senior specialists on accounts, not juniors learning on your budget. They take responsibility for the full funnel, from traffic through conversion to retention, because a leak anywhere wastes spend everywhere in this market. They are transparent: accounts in your name, data in your dashboards. They commit targets in writing. And in 2026, the best are building client visibility inside AI-generated answers, because Chennai’s B2B buyers and healthcare researchers are adopting ChatGPT, Gemini and Perplexity faster than most Indian cities. Get Free Growth plan Why Aim n Launch Is the Right Partner for Chennai’s Growing Businesses Our founders run their own D2C brand with personal money on ads, SEO and retention every day. That operator experience travels directly into how we treat client budgets and set targets. We deliver an integrated system for Chennai businesses: digital marketing services in Chennai covering SEO with Tamil-first content options, Google and Meta advertising, social media, email and WhatsApp retention, landing pages, CRO and our early Generative Engine Optimization practice that places clients inside AI answers before competitors notice the shift. We serve hospitals and specialty clinics, auto component and engineering manufacturers, SaaS and IT companies from OMR, silk and jewellery retailers from T Nagar, colleges and coaching institutes, D2C brands and exporters. The common thread is revenue reporting and senior-led delivery. Get Free Growth plan Chennai’s Biggest Digital Marketing Categories and What Each Needs Healthcare and Hospitals Chennai is a medical hub for South India and a growing medical travel destination. The best agency for a hospital understands compliance boundaries, map pack optimization for specialty searches, review generation systems that build patient trust, treatment content that earns organic visibility and international patient targeting for Gulf, Southeast Asia and Sri Lanka audiences. See how this applies: digital marketing company in Kerala for context on nearby medical travel markets. Manufacturing and Exports Chennai’s auto and industrial corridor is one of India’s largest. B2B buyers shortlist suppliers from Google before calling anyone. The best agency understands how to translate engineering capability into buyer-search keywords, how to build credibility through a website that functions as a factory visit and how to produce export RFQs through both SEO and targeted international campaigns. SaaS and Technology OMR’s product companies need agencies fluent in comparison-driven buyer journeys, bottom-funnel content, LinkedIn pipeline building and CRM-connected attribution. Traffic is meaningless if it is not connected to qualified demos and closed revenue. Education and Coaching Admissions are the metric, not clicks. The best agency plans backward from your intake calendar, builds parent and student proof into creative, and runs counselling follow-up sequences that convert enquiries months after the first click. Retail: Silk, Jewellery and Fashion Visual categories that sell trust and occasion. Instagram, reels, festive campaign calendars, Shopify or custom ecommerce and WhatsApp retention are the stack. The agency should understand how to turn a T Nagar showroom into a national brand. Get Free Growth plan What to Ask Before Shortlisting Any Chennai Agency Show me a real monthly report for a business in my category. Which numbers lead it? Who handles our account daily and how senior are they? Will all accounts and assets stay in our name with full admin access? What cost per result target will you commit to in writing before we launch? How are you building AI search visibility for clients in 2026? What is your approach to Tamil language content and local SEO? What are your exact contract terms and notice period? Get Free Growth plan Common Mistakes Chennai Businesses Make When Hiring an Agency The most common is choosing by fee alone. Five thousand rupee packages fund copy-paste work that costs far more in lost opportunity than it saves. The second is choosing by category fame, hiring a consumer creative agency for a B2B exporter because the name sounds impressive. The third is signing a long lock-in before results exist, which removes the agency’s performance incentive. The fourth is never calling the reference clients provided and relying on case studies that can be polished to look like anything. Get Free Growth plan Internal Links to Explore Our Work If you are comparing us against agencies in related markets, these pages may help: Best digital marketing company in Bangalore: strong overlap in SaaS and D2C categories Digital marketing company in Coimbatore: manufacturing and industrial depth Digital marketing company in India: our full national framework Get Free Growth plan Book a Free Audit for Your Chennai Business Aim n Launch
Best Digital Marketing Company in Indore: What to Look For in 2026
Best Digital Marketing Company in Indore: What to Look For in 2026 Indore Is Rising. Is Your Digital Marketing Keeping Up? India’s cleanest city is also one of its most ambitious. Indore’s coaching institutes compete nationally. Its hospitals draw patients from across MP. Its food brands, led by the legendary namkeen, have national nostalgia built in. Its real estate market is growing fast along the Super Corridor and bypass. And its digital marketing agencies range from genuinely excellent to deeply disappointing, often charging similar fees for radically different results. Finding the best digital marketing company in Indore requires more than a Google search and a sales call. It requires a framework that matches agency type to your business stage, a set of questions that separate performers from packagers and enough market knowledge to recognize when a pricing range is fair or a promise is hollow. This guide gives you all three. What Best Looks Like in the Indore Market Indore’s buyers are thorough. Parents researching coaching institutes compare toppers, batches, faculty and reviews before calling. Patients shortlist hospitals from the map pack and from content. Real estate buyers spend weeks online before a site visit. The best digital marketing companies in this market understand this research-heavy buyer and build funnels to match it. Four things separate the best from the rest in Indore specifically. First, they understand seasonal windows. The coaching and education admission season, the Diwali and wedding season for food and jewellery and the pre-Dussehra window for real estate follow tight calendars. The best agencies plan campaigns backward from these windows; the rest launch late and miss peak demand. Second, they respect the vernacular. A large share of Indore’s buyers search and decide in Hindi and Marathi. Agencies that write all ads in English alone are leaving a significant share of demand uncaptured. Third, they measure admissions and enquiries, not clicks. In the city’s biggest categories, coaching and healthcare, the metric your team actually cares about is cost per counselling call or cost per OPD booking, not cost per form fill. The best agencies report the number that matters. Fourth, they are building for AI. Google AI Overviews and assistants like ChatGPT increasingly answer searches like best NEET coaching in Indore and best hospital for cardiac care in MP by naming specific businesses. Almost no agency in the city is preparing clients for this yet, which means early movers have an uncontested opportunity. Get Free Growth plan Why Aim n Launch Is the Best Choice for Indore Businesses That Want to Scale Our founders run their own D2C brand. We know what a bad acquisition cost week feels like from the owner’s chair, which changes how carefully every campaign is planned and every rupee is managed. For Indore businesses, our digital marketing services in Indore cover the full growth stack: local and category SEO with Hindi content, Google and Meta campaigns, social media management, WhatsApp and email retention, Shopify builds for food and D2C brands and our AI search optimization practice that few agencies in MP can match. Reports lead with admissions, enquiries, orders and cost per result, not screenshots of dashboards. We specialize in Indore’s biggest categories: coaching and education, healthcare, real estate, food and D2C brands, and B2B firms winning RFQs from across India. Get Free Growth plan What Should a Good Digital Marketing Agency in Indore Cost? Context matters. Single channel work such as local SEO or Google Ads management typically starts around twelve to twenty thousand rupees monthly at a credible independent in this market. Integrated programs covering SEO, paid media, social and retention commonly range from twenty-five to sixty thousand monthly, excluding ad spend. Below these ranges, you are usually buying copy-paste templates and boosted posts. Well above them for a single city, you may be paying enterprise overheads for a market that does not require them. The right anchor is always the return: if a program generating forty qualified enquiries monthly costs thirty thousand in fees, the arithmetic almost always works regardless of category. Get Free Growth plan Red Flags to Watch in Indore’s Agency Market If an agency guarantees you a specific ranking on Google, end the meeting. No honest agency guarantees algorithm outcomes. If they create your ad accounts in their own name, walk away: you will lose your data, audiences and learning history if you ever leave. If their sample report leads with followers gained and reach achieved, that is the metric they optimize for. If they cannot tell you exactly who will work on your account week to week, assume it will be whoever is available. Get Free Growth plan How Indore Compares to Nearby Markets Indore occupies an unusual position in central India: it has metro-level demand in its key categories with pre-metro digital competition in most of them. That gap closes every year as more businesses get serious about digital. The playbooks that work in Mumbai and Pune apply here now, at lower auction costs, which is precisely why the return on a well-run program in Indore is often better than the same spend in a saturated metro. For context on how we approach nearby markets, see our pages on digital marketing in Jaipur, digital marketing in Lucknow and our India overview. Get Free Growth plan Book a Free Audit for Your Indore Business Aim n Launch offers a free strategy session: a real audit of your visibility, campaigns and conversion, benchmarked against your Indore competitors, with a ninety day roadmap you keep regardless of what you decide. Book by call, WhatsApp or the form on our Indore digital marketing page. Indore leads India when it decides to; let your business lead its market next. Get My Free Growth Plan
Top Digital Marketing Companies in Mumbai: A 2026 Guide for Growing Businesses
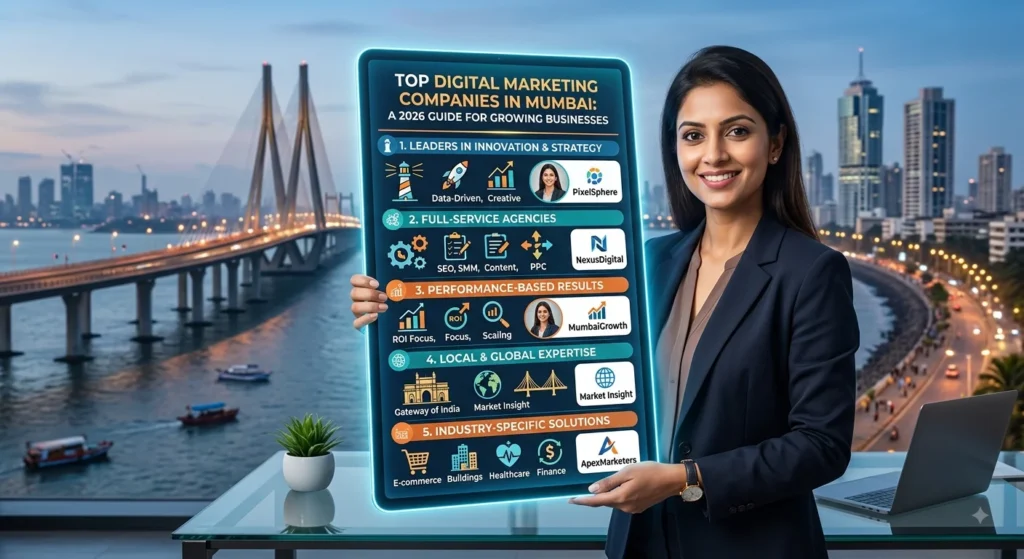
Top Digital Marketing Companies in Mumbai: A 2026 Guide for Growing Businesses Why Choosing the Right Digital Marketing Company in Mumbai Matters More Than Ever Mumbai is India’s proving ground. The country’s financial capital packs its most competitive categories, its largest D2C brands, its highest auction prices and its most discerning consumers into one relentless market. In this environment, picking the wrong digital marketing partner does not just slow growth; it quietly funds your competitors while you pay the bill.The city has no shortage of agencies claiming to be the top digital marketing companies in Mumbai. Every homepage leads with awards, every deck shows growth charts and every sales call sounds the same. The real question is not who claims to be best but what evidence they will put in front of you before you sign anything.This guide cuts through the noise. We cover what the genuinely top companies in this market have in common, what you should demand to see before shortlisting anyone, how pricing maps across the city and how Aim n Launch earns its place in any credible conversation about Mumbai’s best. What Separates the Top Digital Marketing Companies in Mumbai from the Rest Strip away the branding and the leading agencies share five traits that average shops cannot fake for long. They Measure Revenue, Not Reach The most reliable shortlist filter is the sample monthly report. Top companies lead with leads, orders, cost per acquisition and return on ad spend. Average companies lead with impressions, reach and engagement, because those are the metrics that look good when the real ones do not. They Keep Senior People on Your Account In weaker agencies, the impressive team from the pitch call disappears after signing and juniors handle delivery. Ask who specifically will run your campaigns weekly, how senior they are and whether you can speak to them directly. The answer tells you everything about how your account will actually be treated. They Own the Full Funnel Traffic is not the product. Revenue is. Top companies take responsibility for landing pages, conversion, email and WhatsApp retention alongside media buying, because a leak anywhere wastes spend everywhere. In Mumbai’s expensive auctions, single channel vendors cost more than they save. They Are Transparent by Default Accounts created in your name, scopes in writing, honest reporting that flags failures before you ask. Agencies that hide access or deliver dashboard screenshots instead of analysis are building leverage, not partnerships. They Are Prepared for AI Search Buyers now ask ChatGPT, Gemini and Perplexity for recommendations, and Google answers a growing share of queries with AI Overviews. The top digital marketing companies in Mumbai are building client visibility inside these answer engines today. Agencies without an answer to this question are optimizing for a search landscape that is dissolving. Get Free Growth plan Top Digital Marketing Companies in Mumbai: The Honest List Different businesses need different partners. Here is an honest breakdown across the main agency types operating in Mumbai. Aim n Launch: Best for D2C, Ecommerce and Growth Stage Brands We make our case openly rather than through adjectives. Aim n Launch is a performance-driven digital marketing company built by founders who run their own D2C brand, which means every strategy we sell has been tested with our own money. We deliver SEO, Google and Meta advertising, social media, email and WhatsApp retention, content, landing pages and CRO as one integrated system, with reporting that leads with revenue. If you are a D2C or ecommerce brand, a growth stage company or any business that needs results it can measure, our digital marketing services in Mumbai are built for your situation. Two things make us genuinely distinct: operator DNA from running our own brand, and early specialization in Generative Engine Optimization, placing clients inside AI-generated answers before most of the market has started. Large Network Agencies Publicis, dentsu, WPP and their India arms handle enterprise clients with brand scale budgets and procurement processes. They do excellent work for the right audience: national campaigns, multi-market media and brand fame. The trade off for smaller accounts is clear: you pay enterprise overheads for junior attention. If you are not their largest client in the room, look elsewhere. Mid-Market Full Service Agencies A busy layer of mid-sized Mumbai shops covers SEO, social, email and ads under one roof with moderate pricing. Quality varies widely; the best are genuinely capable, the average sell the same package to every industry. The evaluation questions later in this article separate the two. Specialist Performance Boutiques Several Mumbai boutiques focus tightly on one or two channels: paid media only, or SEO only. Useful when you have strong internal coverage of everything else, risky when no one owns the funnel end to end. Get Free Growth plan How Much Do the Top Digital Marketing Companies in Mumbai Charge? Pricing context protects you from both overpaying and false economy. In the Mumbai market: Single channel retainers (SEO or Google Ads only): typically twenty five to forty thousand rupees per month at quality independents Integrated programs (search, paid, social and retention): commonly fifty thousand to one and a half lakh monthly, excluding ad spend paid to platforms Network agency enterprise retainers: generally start where independents peak, with large brands spending several lakhs monthly The right question is never what does it cost but what does it return. Credible agencies discuss your margins and acquisition targets before quoting, because pricing without economics is guesswork dressed as a proposal. Get Free Growth plan Questions to Ask Before Signing with Any Mumbai Agency Take this list into every evaluation call and the pretenders will reveal themselves quickly. Show me a real monthly report for a business like mine. Which metrics lead it? Who exactly will run our account each week and how senior are they? Will all accounts and assets be created in our name with full admin access? How do you set cost per lead or acquisition targets, and what happens when a campaign misses them? How
Best Digital Marketing Company in Dehradun: 2026 Guide
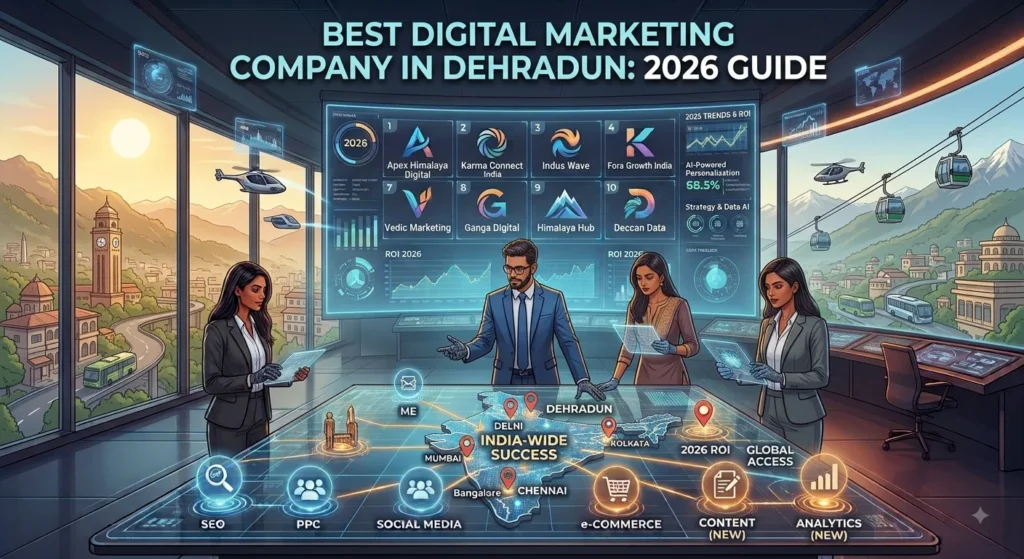
Best Digital Marketing Company in Dehradun: 2026 Guide Dehradun Is Changing Fast. Your Digital Marketing Should Too. Dehradun is no longer just a gateway to the hills. The city has emerged as one of Uttarakhand’s fastest growing business centres: a respected education hub with some of India’s best-known boarding schools and universities, a booming hospitality and real estate market drawing buyers from Delhi and NCR, a growing IT and startup presence in the Tech Park and Sahastradhara Road area, and a healthcare system serving the region and attracting medical visitors from across Uttarakhand and UP. The buyers powering this growth decide online. Parents shortlist schools from search results and reviews before enquiring. Delhi and Noida families research Dehradun real estate on portals and YouTube before a weekend site visit. Patients compare hospitals from the map pack. Tourists book hotels and homestays from Instagram and Google. And a growing number ask ChatGPT or Google’s AI Overviews who to trust. The best digital marketing company in Dehradun understands this buyer behavior and builds systems to win across every channel. What the Best Agency in Dehradun Delivers Best is always relative to fit, but the traits that define genuinely good agencies hold here as everywhere. Revenue reporting: enquiries, admissions, bookings, orders and cost per result lead every monthly review, not followers and impressions. Senior delivery: the strategist who planned your campaign is in the weekly call, not a junior learning on your budget. Full funnel: SEO, paid media, conversion and retention as one system, so no leak between vendors wastes spend. Transparency: accounts in your name, data always accessible. In Dehradun specifically, two market traits matter. First, the Delhi and NCR connection is decisive. A large share of buyers for real estate, second homes, schools and tourism come from NCR. Agencies that can geo-target and convert this specific audience, with funnels that work for remote decision-making before a physical visit, are playing a different game. Second, the seasonal pattern is sharp. Schools fill on admission calendar, real estate peaks on a weekend visit cycle, and hospitality swings between summer, Diwali and year-end windows. Campaigns need to be planned around these, not after them. Get Free Growth plan Aim n Launch for Dehradun’s Growing Businesses Aim n Launch is a performance-driven digital marketing company built by founders who invest personal money in the same systems they recommend. We serve Dehradun as part of our national practice, with full funnel delivery covering local and national SEO, Google and Meta advertising, social media management, WhatsApp and email retention, website design and landing pages, and our AI search optimization practice. For schools, we build the parent-facing search visibility, review systems, proof content and admission funnel that convert NCR parents from a Google search to an enquiry call. For real estate, we run geo-targeted campaigns to Delhi and Noida buyers with qualifying landing pages and WhatsApp follow-up. For hospitality and resorts, we build direct booking engines and destination content. For hospitals and clinics, we combine map pack optimization with compliant healthcare content. Our Dehradun practice connects to our broader North India coverage. For regional context, see digital marketing company in Chandigarh for tricity and NRI targeting and digital marketing company in Lucknow for UP market depth. Get Free Growth plan Pricing: What to Expect in Uttarakhand Dehradun sits in the accessible range of the Indian digital marketing market. Single channel retainers for local SEO or Google Ads management typically start around ten to eighteen thousand rupees monthly at a credible agency. Integrated programs covering search, paid, social and retention generally range from twenty to fifty thousand monthly, excluding ad spend. The anchoring question is return. A school admission worth a lakh and a half in annual fees makes the arithmetic forgiving at almost any fee in this range. A real estate conversion worth several crores is even more so. Agencies that can have that conversation clearly, before quoting, deserve the shortlist. Get Free Growth plan Common Mistakes Dehradun Businesses Make When Hiring The most common is thinking local means cheap and accepting packages that produce no measurable results because the price felt safe. The second is not factoring in the NCR buyer: Dehradun businesses that market only locally are ignoring the audience with the most purchasing power. The third is starting campaigns without a proper tracking setup, so nobody knows which channel produced which enquiry. All three are fixed in onboarding by any serious agency, and the absence of fixing them in month one is itself a signal. Get Free Growth plan Explore Our Work Across India Digital marketing company in Gurgaon: NCR premium and B2B depth Digital marketing company in Jaipur: education, tourism and D2C Best digital marketing company in India: our full national framework Get Free Growth plan Book a Free Audit Aim n Launch offers a free strategy session for Dehradun businesses: a real audit of your visibility, campaigns and conversion, with a ninety day roadmap you keep whatever you decide. Call or WhatsApp to book. Dehradun’s moment is now; let your marketing match its ambition. Get My Free Growth Plan