₹8.16L spent on Meta. ₹39.65L in Shopify revenue. 4,265 orders, up 304% from the month before. Blended ROAS of 4.86x in a heavy-discount month. Here is the campaign architecture, the offer logic, and the unit economics behind it, with the actual numbers
from both sides.
A direct to consumer beverage brand in the functional drinks category in India. Real product, real repeat behavior, real customer base. The brand had been spending on Meta consistently and had a proven category fit.
What they wanted from April 2026 was simple. Peak season for functional beverages in India runs from April through June. The brand needed a month that took full advantage of the demand window, without burning unit economics in the process.
The plan we walked in with was not “test more, spend more”. The plan was “concentrate the account, build for the offer, and let the algorithm do its job”.
Functional beverages are seasonal. The customer is most ready to buy in April and May. In a seasonal category, the way to scale is not to run the same evergreen prospecting at higher budgets. The way to scale is to design the entire account around the seasonal offer.
We made three structural decisions before the month started.
Five campaigns. Each one with a clear job. No overlap, no audience cannibalization, no testing breadth
that the algorithm could not learn from.
1. ABO image-ad campaign running the headline sale offer with multiple image creative variants
2. ABO video-ad campaign running the same offer with video-format creative
3. ASC (Advantage Plus Shopping) campaign for the bottom-funnel sale push
4. CBO running max-value bidding for higher-AOV bundle variants
5. CBO for retargeting and warm cohorts with proven creative
Budget was concentrated. Each ad set got enough daily spend to find signal fast. The algorithm did not
have to choose between forty ad sets fighting for the same impression.
A common mistake in Meta accounts is stuffing image and video creative inside the same ad set and hoping the algorithm picks the right one. It almost never does. The algorithm picks the cheapest impression, not the most profitable purchase.
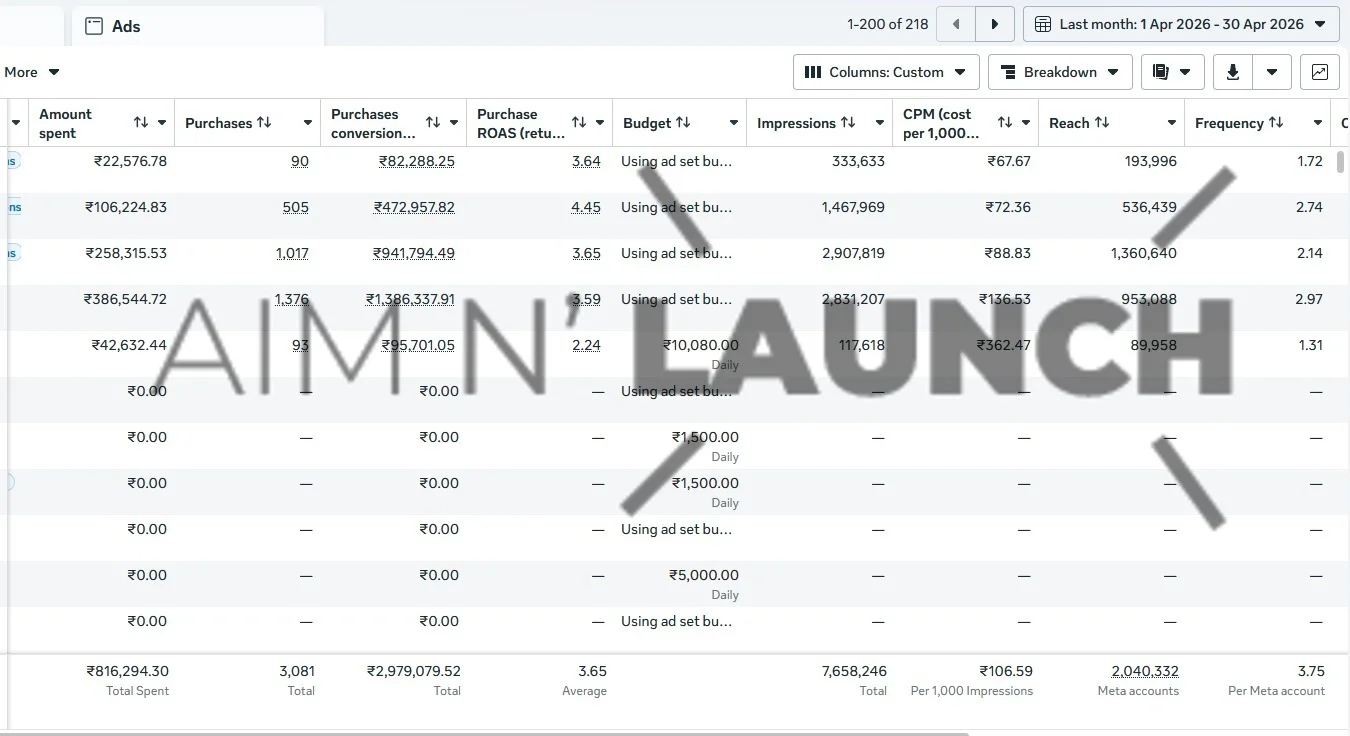
We split image and video into two parallel ABO campaigns running the same offer. Each format got to find its own audience, its own placement mix, and its own time-of-day pattern. Both campaigns ended up profitable. The video campaign delivered 3.65x ROAS at ₹2.58L spend. The image campaign delivered 3.59x ROAS at ₹3.87L spend. Together they did the heavy lifting on volume.
Most brands run Advantage Plus campaigns as if they are the entire account. We treated ASC as a specialized weapon for the sale window. Tight creative pool, sale-led offer, no broad evergreen messaging dragging it down.
This single ASC campaign delivered the highest ROAS in the account at 4.45x on ₹1.06L spend. It worked because it was given one job and the creative inside it was built for that job.
In a sale window, the offer is the hero. Not the brand story, not the product feature list, not the founder backstory. The customer scrolling Instagram in April needs a reason to buy this week, not next month.
We built creative around three principles:
Offer first, second, and third. The hook, the visual, and the CTA all pointed at the sale, not the product feature
Format split. Image ads ran a punchy offer-led format. Video ads ran a 15 to 20 second sale-led format with the offer in the first three seconds
Concentration over breadth. By mid-month, three creative concepts were doing 92% of total spend. The rest were paused or held for May retest. Concentrating spend on proven winners gave the algorithm cleaner signal and reduced waste
| Metric | Value |
|---|---|
| Active campaigns | 5 |
| Total spend | ₹8.16L |
| Impressions | 7.66M |
| Reach | 3.13M |
| Link clicks | 88,118 |
| CPM | ₹106.59 |
| Link CTR | 1.15% |
| Link CPC | ₹9.26 |
| Meta-attributed purchases | 3,081 |
| Meta-attributed ROAS (weighted) | 3.65x |
| Top campaign ROAS (ASC sale) | 4.45x |
Three campaigns drove 92% of spend. All three were profitable. None of the spend was lost to creative fatigue or audience cannibalization because the structure was designed to prevent both.
| Metric | Value | vs March |
|---|---|---|
| Gross sales | ₹59.80L | +265% |
| Discounts | -₹20.21L | (33.8% of gross) |
| Returns | -₹0.76L | - |
| Net sales | ₹38.84L | +265% |
| Total sales (incl. shipping, taxes) | ₹39.65L | +265% |
| Orders | 4,265 | +304% |
| AOV (Total sales basis) | ₹928.40 | -10% |
| Returning customer rate | 11.02% | -49% |
| Metric | Value |
|---|---|
| Meta ad spend | ₹8.16L |
| Total Shopify revenue | ₹39.65L |
| Blended ROAS | 4.86x |
| % of orders from Meta-attributed traffic | 72.2% |
| % of orders from other channels (organic, direct, repeat) | 27.8% |
| Estimated CM2 per order | ~18% of net AOV (~₹170) |
| Estimated total monthly CM2 | ~₹7.26L |
The 1.21x gap between Meta-attributed ROAS (3.65x) and blended ROAS (4.86x) is the value the brand earned from organic and repeat traffic on top of paid acquisition. That gap is a healthy signal. It means the brand has equity that exists outside the ad account.
Two metrics moved in directions worth being honest about.
AOV dropped 10%. This was a deliberate choice. A sale-window strategy pulls AOV down because customers buy on price. We accepted this for April because the order volume gain, 4x more orders, more than paid for the AOV drop on a contribution margin basis. The CM2 math still worked.
Returning customer rate dropped 49%. The denominator math is mostly responsible here. When total orders quadruple in a month, the share of repeat buyers in the total order mix collapses even if absolute repeat orders are stable or growing. New customer count went up 4x and existing customers did not buy four times more in the same window. That is the entire story behind the percentage drop.
The work for May is to convert the April acquisition wave into repeat purchases. The acquisition was the easy part. Building the post-purchase loop is the next move.
Two things, and only two things.
One. In a seasonal category, the way to scale is to build the account around the offer, not around evergreen prospecting at higher budgets. The 5 campaigns we ran were not a coincidence. Each had a clear job. Each had room to find signal because budget was concentrated, not scattered.
Two. A 4.86x blended ROAS in a month where 33.8% of gross sales was given away as discount is not luck. It is what happens when the creative, the offer, and the campaign structure are designed to work together instead of fighting each other. CM2 still landed at roughly 18% per order, which is the only number that actually tells you whether scaling was profitable.
We will pull up your Meta account on a one hour Zoom and tell you, on the call, what the next 30 days should be built around. We will also calculate your real blended ROAS and CM2 numbers, so you stop guessing what is profitable and what is just busy. If we find nothing worth fixing, we say so.