This Indian D2C brand operates in the healthy snacks and protein nutrition space. Featured on Shark Tank, the brand sells protein-rich powders, snack packs, and bundles through its Shopify store.
Its primary sales channels included Cashfree OCC and 1CCO for checkout, while Meta Ads served as the main paid acquisition driver. The brand had already achieved product-market fit. Customers loved the products, reviews were strong, and the Shark Tank feature had created a meaningful visibility boost. But that visibility was not translating into predictable, scalable revenue.
In January 2026, the numbers looked like this:
| Metric | January 2026 |
|---|---|
| Gross Sales | ~₹7.8L |
| Net Sales | ~₹6.5L |
| Orders | ~900 |
| AOV | ~₹747 |
| Returning Customer Rate | ~3.3% |
| Discounts Given | ~₹1.01L |
Not bad for a growing brand. But it was still far below what the product and market opportunity could actually support.
The brand was leaving serious money on the table, and the bottleneck was not demand. It was the way that demand was being captured.
The brand had strong products. Multiple SKUs across protein powders, flavored variants, snack bundles, and sampler packs. But that catalog diversity was actually hurting them.
Here’s what we diagnosed when we looked under the hood:
Ad spend was distributed almost evenly across a dozen SKUs. No single product was getting enough budget to build momentum. Meta’s algorithm needs signal density to optimize. When you spread ₹7–8L across 10+ products, none of them get enough conversion data to properly exit the learning phase.
The result: inconsistent ROAS, high CPAs, and campaigns that never stabilized.
The brand had bundle options (3+1 packs, combo packs), but these were treated as just another SKU in the catalog. They weren’t positioned as the primary conversion path. Bundles were buried in product listings—not front and center in ad creatives or landing pages.
This was a massive missed opportunity. Bundles naturally increase AOV, improve perceived value, and give Meta a higher purchase value signal to optimize toward.
Discounts existed, but they were applied inconsistently. Sometimes 10% off, sometimes flat ₹100 off, sometimes no discount at all. There was no math behind the offers. No understanding of how much discount the unit economics could absorb while still maintaining healthy contribution margins.
When discounts aren’t engineered, two things happen: either you leave conversions on the table (too little discount), or you destroy margins without realizing it (too much discount with no AOV floor).
At just 3.3%, the returning customer rate meant the brand was essentially running a new-customer acquisition machine every single month. There was no system to bring buyers back—no post-purchase flow, no “next best product” nudges, and no loyalty hook.
For a consumable category like protein snacks, this is a critical miss. These are products people finish and need to reorder. But without a retention system, every customer became a one-time buyer unless they happened to see another ad.
Revenue was split across Cashfree OCC (₹1.47M), 1CCO, and a small contribution from the online store. But there was no strategy behind it—no push toward prepaid over COD, no incentive structure for payment method selection, and no data-driven clarity on which channel brought in higher LTV customers.
Despite strong product-market fit, national visibility from Shark Tank, and genuine customer love, the brand was stuck at ₹7–8L per month.
The issue wasn’t demand—it was fragmented growth infrastructure.
The highest-margin, highest-AOV product in the catalog was the “Shark Favorite 3+1 Pack” bundle. But it was getting the same ad budget allocation as individual powder variants that sold for one-third the price.
We made the 3+1 bundle the hero offer. Everything revolved around it.
The entire creative strategy was rebuilt around the bundle. Ad copy, visuals, hooks, and landing page hierarchy all pointed to the 3+1 pack as the default purchase.
Individual SKUs were repositioned as entry points and upsell paths, not primary conversion targets.
The bundle pricing was engineered so that even with discounts, the effective ASP stayed above ₹750. This ensured that every sale carried enough value to sustain ROAS at scale.
We also ran full contribution margin math before scaling. After factoring in ad spend, discounts, shipping, and returns, the bundle’s CM2 remained positive at the target CPA.
This is where most brands fail—they don’t calculate this before scaling. And that’s the difference between profitable growth vs burning cash.
The 3+1 bundle alone generated ₹19.7L in February, a 448% increase from January.
It contributed 65% of total gross sales from a single offer.
When you consolidate signal around one high-value product, Meta’s algorithm gets exactly what it needs—dense conversion data on a high-AOV event.
The result:
This is how you turn chaos into controlled growth.
The previous campaign structure had too many ad sets targeting too many products with too little budget per set.
This is one of the most common mistakes in Indian D2C Meta Ads: over-segmentation.
We rebuilt the campaign structure into a simplified, high-signal architecture:
Top of Funnel (Prospecting)
Broad audiences with the bundle as the primary offer. Instead of restricting Meta with narrow interest targeting, we let the algorithm find the buyers.
The creative did the targeting work—not the audience settings.
Mid Funnel (Consideration)
Retargeting users who engaged but didn’t purchase.
Messaging shifted from “discover this product” to
“here’s why the 3+1 pack is the smartest choice.”
Focused on:
Bottom Funnel (Conversion)
Cart abandoners and high-intent audiences.
Used dynamic product ads with the bundle featured prominently, along with offer stacking (discount + free shipping) to close conversions.
Budget allocation followed a 60 / 25 / 15 split across TOF / MOF / BOF.
Most brands over-invest in BOF retargeting. We intentionally kept TOF heavy because the bundle had enough margin to sustain longer attribution windows.
Fewer campaigns meant more budget per campaign.
More budget per campaign led to faster learning.
Faster learning resulted in lower CPAs within the first week.
By week two, campaigns were fully optimized—and we started scaling budgets aggressively.
In January, discounts were ~₹1.01L on ~₹7.8L in gross sales—roughly a 13% discount rate.
Not terrible, but not strategic either.
Discounts were being applied without any understanding of their impact on AOV, conversion rate, or margins.
In February, we intentionally increased discounts to ₹6.15L (a 505% increase).
That sounds aggressive—but it was calculated, not reckless.
The discount was baked into the bundle math.
The 3+1 pack already had a built-in perceived discount (“buy 3, get 1 free”). Adding an extra percentage discount on top created a strong value proposition without breaking unit economics.
AOV went up, not down.
Despite heavier discounts, AOV increased 6% (₹747 → ₹791).
The bundle structure forced multi-item carts. Customers weren’t buying cheaper—they were buying more.
Net sales grew 263%
From ₹6.5L → ₹23.6L.
The discount funded volume. But because AOV held (and increased), the overall revenue impact was massively positive.
Before scaling, we ran full contribution margin math:
Everything was mapped against expected AOV.
The math had to work at the unit level before we scaled at the campaign level.
Most brands either:
We treated discounts as an investment with measurable ROI.
The ₹6.15L in discounts generated ₹23.6L in net sales.
That’s a 3.8x return on discount investment alone—before even factoring in LTV.
The brand’s payment mix was not optimized.
COD orders were driving:
For a protein/health brand, this was a clear gap. The audience is typically health-conscious and digitally comfortable—meaning prepaid conversion potential is naturally high if positioned correctly.
We pushed Cashfree OCC as the primary checkout experience, supported by prepaid-specific incentives:
The goal was simple: make prepaid the default, not the exception.
| Channel | February Revenue |
|---|---|
| Cashfree OCC | ₹14.7L |
| 1CCO | ₹10.2L (+49%) |
| Online Store | ₹7.7K |
A prepaid-heavy order mix leads to:
At scale, the difference between 60% prepaid vs 99% prepaid can drive a 3–5% margin improvement per order.
Returning customer rate was just 3.3% in January.
For a consumable product like protein powder (typically finished in 3–4 weeks), this was a major red flag.
Customers were buying once—and disappearing.
We built the initial layer of a retention system:
Post-purchase segmentation
New buyers were tagged and entered into a timed re-engagement sequence.
At the 3-week mark (aligned with product consumption), they were shown targeted ads:
Bundle as a retention hook
The 3+1 pack wasn’t just an acquisition offer—it became a retention lever.
A customer buying 4 units had 3–4 months of product usage.
During this window, we ran low-budget touchpoints:
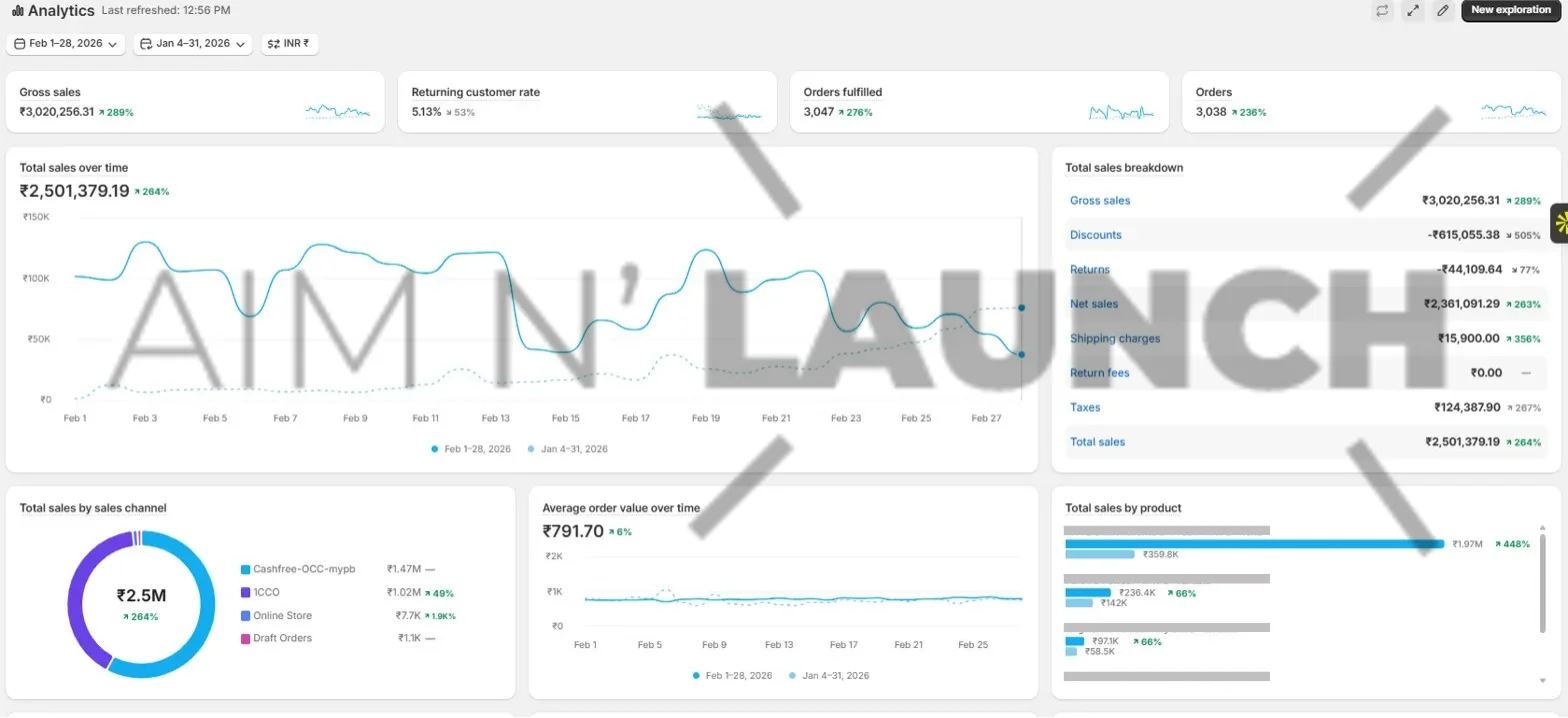
| Metric | January 2026 | February 2026 | Change |
|---|---|---|---|
| Gross Sales | ₹7.8L | ₹30.2L | +289% |
| Net Sales | ₹6.5L | ₹23.6L | +263% |
| Orders Fulfilled | ~900 | 3,047 | +276% |
| Total Orders | ~900 | 3,038 | +238% |
| AOV | ₹747 | ₹791 | +6% |
| Conversion Rate | -- | 2.87% | -- |
| Returning Customers | 3.3% | 5.13% | +53% |
| Hero Bundle Revenue | ₹3.6L | ₹19.7L | +448% |
| Shipping Revenue | -- | ₹15,900 | +356% |
| Taxes Collected | -- | ₹1.24L | +267% |
| Channel | Revenue | Growth |
|---|---|---|
| Cashfree OCC | ₹14.7L | Primary channel |
| 1CCO | ₹10.2L | +49% |
| Online Store | ₹7.7K | +1.9K% |
| Product | February Revenue | Growth |
|---|---|---|
| Shark Favorite 3+1 Pack | ₹19.7L | +448% |
| Pure PB Powder | ₹2.36L | +66% |
| Original PB Powder | ₹97.1K | +66% |
If there’s one takeaway from this case study, it’s this:
One hero bundle, engineered correctly, did more than an entire catalog of scattered SKUs.
The 3+1 pack accounted for 65% of total gross sales. When you consolidate ad spend behind a single offer with strong unit economics, everything compounds.
This wasn’t about spending more on ads.
Total discounts increased 505%, but net sales grew 263% and AOV increased simultaneously.
The math was planned before a single rupee was spent.
If you’re a D2C brand doing ₹5L+ per month in ad spend and you recognize any of these patterns:
Then your growth bottleneck isn’t your product or your market.
It’s your system (or lack of one) connecting the two.
We’ll analyze your Shopify store, ad account, and payment flows, run a full CM2 waterfall, and show exactly:
This case study was prepared by Aim n Launch, a D2C performance marketing agency specializing in Meta Ads, Google Ads, CRO, and Shopify growth systems for Indian brands.
We work exclusively with brands doing ₹5L+ per month in ad spend.