If you are running a D2C brand in India and spending Rs 5 lakh or more per month on Meta ads, you have probably asked yourself one of these questions at least once this quarter: “Is my ROAS good enough?” or “What are other brands in my category actually getting?”
The answer is not a single number. It depends on your category, your margins, your creative strategy, and whether you have moved beyond the manual campaign setups that stopped working in 2024.
We manage Meta ad spends across 50+ Indian D2C brands at Aim n Launch, covering beauty, fashion, food, health, and home categories. This post shares the actual ROAS benchmarks we are seeing in 2026, broken down by category, along with the strategies that separate 2x brands from 4x brands.
Want us to audit your Meta ads and tell you exactly where your ROAS leaks are? Book a free ROAS audit here.
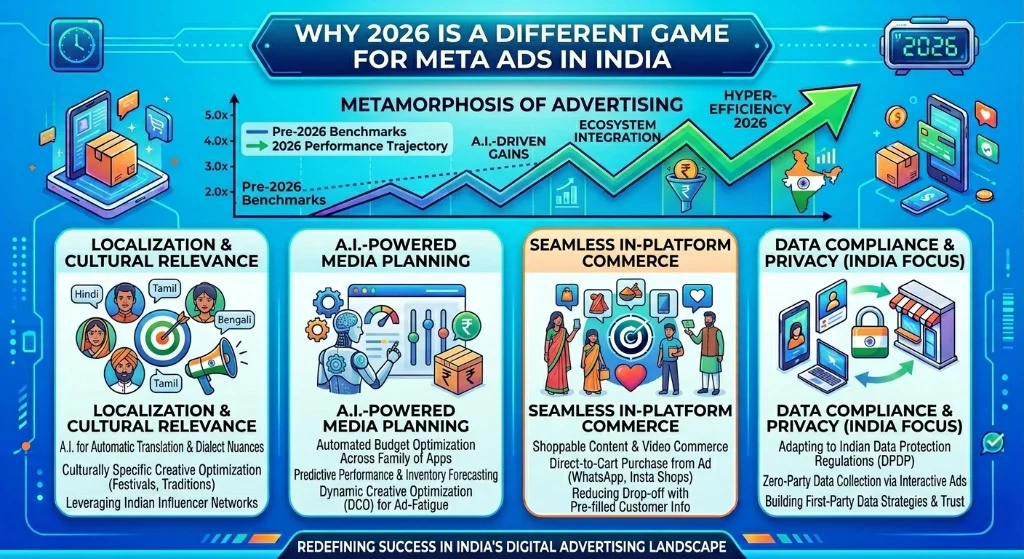
Before we get into the numbers, you need to understand why benchmarks from 2024 or even early 2025 are no longer reliable.
Three structural shifts have changed the Meta ads landscape in India:
CPM inflation is real and accelerating. The average CPM for D2C brands in India hit Rs 850 in 2025, up 22% year-on-year. Since 2023, CPMs have risen 40% to 60% across most ecommerce categories. More advertisers, more competition for the same eyeballs, higher floor prices. If your creative and targeting have not evolved, you are paying 2023 prices for 2026 impressions.
Algorithm-driven targeting has replaced manual audiences. As of 2026, roughly 90% of Meta’s targeting is algorithm-driven. The platform’s machine learning decides who sees your ads, not your interest stacks or lookalike audiences. This means your job has shifted from “finding the right audience” to “feeding the algorithm the right creative signals.”
Advantage+ Shopping Campaigns (ASC) are now the default. Meta’s own data shows ASC outperforms manual campaigns by 17% to 32% on cost per purchase for ecommerce brands. If you are still running traditional conversion campaigns with manually stacked audiences, you are almost certainly overpaying for results.
These shifts mean that the ROAS your brand achieved 12 months ago is not a useful baseline. The brands hitting 3x to 4x ROAS today are doing fundamentally different things than the brands stuck at 1.5x to 2x.
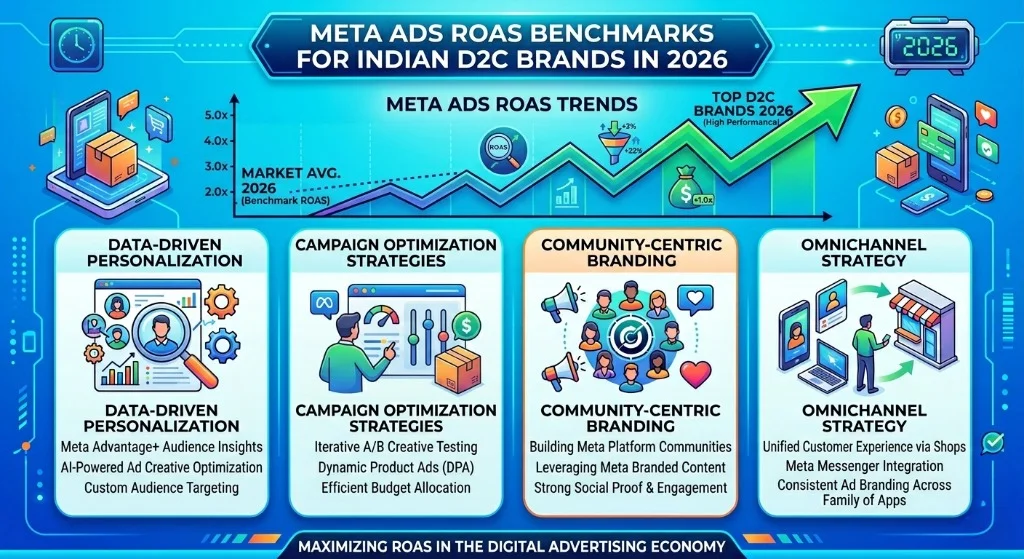
Here is what we are seeing across our portfolio of 50+ campaigns in Q1 2026. These are blended ROAS numbers (combining prospecting and retargeting) measured on a 7-day click, 1-day view attribution window.
Beauty remains one of the strongest categories on Meta in India.
Average ROAS across our beauty clients sits at 3.0x to 3.5x for blended campaigns. Cold audience prospecting typically delivers 2.5x to 3.5x, while retargeting campaigns hit 6x to 10x. Skincare serums and treatments land in the 2.5x to 3.5x range. Fragrances consistently outperform at 4x to 5x. Haircare is the toughest sub-category, averaging 1.8x to 2.5x due to lower AOVs and repeat purchase cycles.
Brands like Minimalist and Pilgrim have set the template here. They combine ingredient-education content (which builds trust and reduces the consideration cycle) with aggressive UGC-first creative strategies on Reels and Stories.Key benchmark: If your beauty brand is below 2.5x blended ROAS on Meta in India, your creative strategy or product page conversion rate needs immediate attention.
Fashion is a volume game with tighter margins, and the benchmarks reflect that.
Average blended ROAS ranges from 2.5x to 3.5x. Fast fashion and impulse-purchase items (under Rs 1,500 AOV) tend to hit 3x to 4x due to quicker purchase decisions. Premium fashion (Rs 2,500+ AOV) averages 2x to 2.8x with longer consideration windows. Athleisure and activewear brands like Snitch have pushed into the 3.5x range by combining trend-driven creative with rapid inventory turnover.
The critical variable in fashion is creative velocity. Brands refreshing creatives weekly outperform those on monthly cycles by 25% to 40% on cost per purchase.
Key benchmark: Below 2.5x blended ROAS for fashion means either your AOV is too low to support paid acquisition, or your creative is fatiguing faster than you are replacing it.
F&B is the hardest category to make work on Meta in India, and the data confirms it.
Average blended ROAS sits at 1.5x to 2.5x. Subscription-based models (like protein supplements or health foods) do better at 2x to 3x because of higher LTV. Single-purchase, low-ticket items (snacks, beverages under Rs 500) often struggle to cross 1.5x.
The challenge is structural: low ticket prices, high shipping costs relative to product value, and perishability constraints. The brands winning here, like Slurrp Farm and Yoga Bar, combine Meta ads with aggressive subscription pushes and bundle offers that lift AOV above Rs 800.
Key benchmark: If your F&B brand is hitting 2x+ blended ROAS on Meta, you are outperforming the category. The real lever is LTV, not first-purchase ROAS.
This is the most expensive category for CPMs in India, with a 38% increase in CPM inflation in 2025 alone.
Average blended ROAS ranges from 2x to 3x. Nutraceuticals and supplements average 2.5x to 3.5x when backed by strong clinical claims and influencer validation. Fitness equipment and home wellness products tend to be lower at 1.8x to 2.5x. Ayurvedic and natural wellness brands that combine D2C with marketplace presence often report higher blended ROAS because Meta drives consideration while Amazon or Flipkart captures the conversion.
Brands like Kapiva have cracked this by layering educational content (ingredient deep-dives, doctor testimonials) into their ad funnels, which reduces CPA by building trust before the purchase decision.
Key benchmark: Health brands spending below Rs 10L/month often underperform because they cannot generate the 50 optimization events per week Meta needs to exit the learning phase.
Home decor, furnishing, and lifestyle brands occupy an interesting middle ground.
Average blended ROAS ranges from 2.2x to 3x. High-AOV items (Rs 3,000+) see lower volume but stronger ROAS per conversion. Brands with visually distinctive products, think Nestasia or The Decor Kart, consistently outperform because their products photograph well and stop scrolls naturally.
Key benchmark: Home brands should target 2.5x+ and compensate for lower purchase frequency by building email lists and WhatsApp communities from Meta traffic.
Knowing the benchmarks is step one. Figuring out why your brand is above or below them is where the real work begins.
We use a five-layer diagnostic framework with every brand we onboard. Here is how it works.
Your ROAS starts with your creative. Period. We evaluate three metrics for every ad creative:
Hook rate (3-second video views divided by impressions). Benchmark: 25%+ for Reels, 20%+ for Feed.
Hold rate (ThruPlays divided by 3-second views). Benchmark: 30%+ means your content is compelling beyond the hook.
Click-through rate. The median CTR across Meta ecommerce ads in India is 1.8%. If you are below 1.5%, your creative is not driving action.
Brands with all three metrics above benchmark consistently hit 3x+ ROAS. Brands with even one metric significantly below tend to plateau at 2x regardless of budget.
The simplest structural question in 2026 is this: are you running Advantage+ Shopping Campaigns?
If no, that is your first fix. ASC outperforms manual campaigns by 17% to 32% on cost per purchase. It requires fewer audience inputs (the algorithm does the work), but it demands strong creative variety (minimum 10 to 15 active creatives) and clean conversion data (your Pixel or Conversions API must fire accurately on every purchase event).
If yes, we audit:
How many creatives are active? (Below 8 is under-feeding the algorithm.) What is your existing customer budget cap? (We recommend 10% to 20% to prevent retargeting from inflating your blended ROAS.) Are you feeding in catalog-based dynamic ads alongside static and video? (The combination consistently outperforms any single format.)
Meta can send you the cheapest clicks in the market, and you will still lose money if your product page converts below 2%.
We benchmark landing page conversion rates by category:
Beauty: 2.5% to 4% Fashion: 2% to 3.5% Food: 1.5% to 2.5% Health: 1.8% to 3% Home: 1.5% to 2.5%
If your conversion rate is below these ranges, your ROAS problem is not a Meta problem. It is a Shopify optimization problem. Fix your product page speed (target under 3 seconds), trust signals, and UPI/COD checkout flow before increasing ad spend.
This is where most D2C founders get confused. A 3x ROAS is meaningless if your margins do not support it.
Here is the math: if your gross margin is 60% and your ROAS is 3x, your ad spend is 33% of revenue, leaving you with 27% gross contribution. After logistics (12% to 15%), payment gateway fees (2%), and returns/RTO (5% to 10%), you might be left with 0% to 10% net contribution.
We use this quick test:
Minimum viable ROAS = 1 / (Gross Margin % minus Fixed Cost %).
For a brand with 65% gross margin and 20% fixed costs, minimum viable ROAS = 1 / (0.65 – 0.20) = 2.22x. Anything below that and you are losing money on every Meta-acquired customer, regardless of what the benchmark says.
Download our free ROAS break-even calculator to run this analysis for your brand. Get it here.
The last layer is the most overlooked. If your Meta Pixel is misconfigured, your Conversions API is not server-side, or you are comparing Meta’s reported ROAS against your Shopify dashboard without accounting for attribution differences, your “ROAS” number is fiction.
Common discrepancies we find:
Meta reporting 30% to 50% higher ROAS than Shopify due to view-through attribution. Conversions API not deduplicating with Pixel events, leading to double-counted purchases. UTM parameters breaking on redirect chains, causing Google Analytics to attribute Meta conversions to direct traffic.
We recommend triangulating: compare Meta Ads Manager ROAS, Shopify attributed revenue, and a blended ROAS calculation (total revenue / total ad spend) across all channels. Your true Meta ROAS usually sits somewhere between Meta’s reported number and your Shopify attribution.
The brands consistently outperforming category averages share a few specific habits.
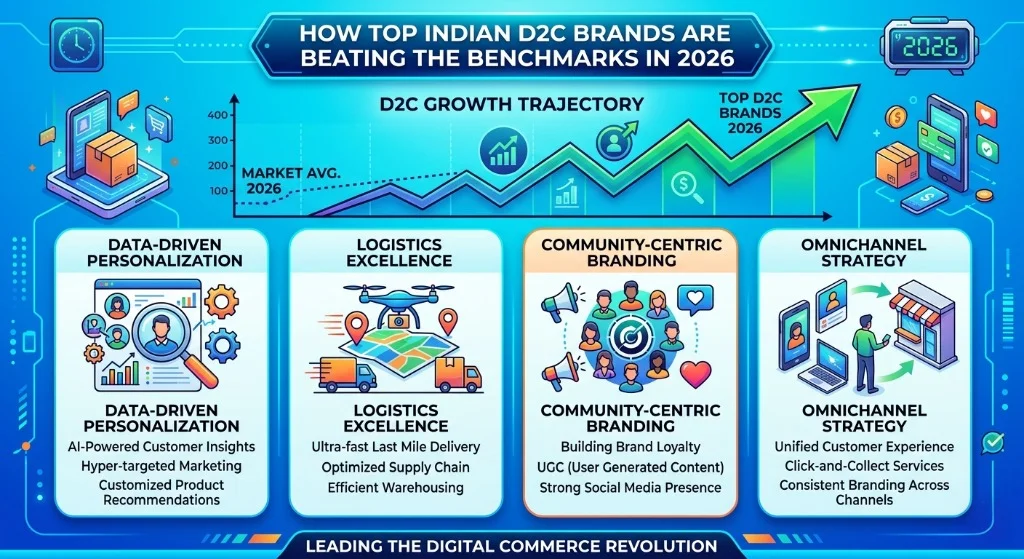
boAt rebuilt its entire performance strategy around creative velocity in 2025. Instead of producing one hero ad per product and hoping it works, the brand now creates 15 to 20 variations per product, each with different openings, captions, and CTAs. They shifted from monthly to weekly creative refresh cycles, and they focus exclusively on mobile-first, short-form, fast-cut creatives designed for Reels and Stories.
The result is consistent 3x+ ROAS even at massive scale, because they are constantly feeding the algorithm fresh signals and avoiding the creative fatigue that kills most brands after week two.
Action step: Audit your last 30 days of Meta ads. How many unique creatives did you launch? If the answer is fewer than 10, you are under-investing in the single biggest ROAS lever available in 2026.
Sugar Cosmetics and Mamaearth both demonstrate that the brands winning on Meta in 2026 are not just running purchase-optimized campaigns. They are layering content across the funnel.
Top of funnel: educational Reels (ingredient spotlights, how-to tutorials, myth-busting) run as Reach or Video Views campaigns to build cheap awareness.
Middle of funnel: UGC testimonials, before-and-after content, and creator partnerships delivered to engaged audiences.
Bottom of funnel: catalog-based dynamic product ads with urgency-driven copy and offers.
This full-funnel approach costs more upfront but reduces CPA at the bottom by 20% to 35% because prospects arrive at the purchase campaign already warmed up.
Action step: Calculate what percentage of your Meta spend goes to non-purchase campaigns. If it is 0%, you are asking cold audiences to buy on first impression, and in 2026, that is increasingly expensive.
The brands hitting 3.5x+ ROAS universally have one thing in common: their data infrastructure is clean. They run Conversions API (server-side) alongside the Pixel with proper deduplication. They use UTM parameters consistently. They track micro-events (add to cart, initiate checkout, view content) alongside purchases so the algorithm has richer optimization signals.
One health brand we onboarded was reporting 1.8x ROAS. After fixing their Conversions API setup and adding proper event deduplication, their reported ROAS jumped to 2.6x, not because performance changed, but because they were finally measuring it correctly.
Action step: Check your Events Manager right now. If your Pixel and Conversions API event match rate is below 80%, you are losing data and the algorithm is optimizing blind.
Based on what is working across our 50+ active campaigns, here is how we recommend Indian D2C brands allocate their performance marketing budget in 2026:
Meta (Reels-first creative, Advantage+ Shopping): 40% to 50% of total ad spend. This remains the primary prospecting and retargeting channel for most D2C brands.
Google Shopping and Performance Max: 25% to 30%. This captures high-intent search demand that Meta creates. The two channels work together, not in isolation.
Emerging channels (YouTube Shorts, WhatsApp Commerce): 15% to 25%. These are the growth channels for 2026 and 2027. Early movers are seeing CPAs 30% to 40% below Meta equivalents.
Testing budget: 5% to 10%. Reserved for new creative formats, new platforms, and audience experiments.
The brands that over-index on Meta (70%+ of spend) tend to hit a ceiling around Rs 15L to 20L/month because of audience saturation. Diversification is not optional at scale.
If you have read this far and your numbers are below the category benchmarks, here is a prioritized action plan:
Week 1: Fix measurement. Verify your Conversions API setup, check event deduplication, and calculate your true blended ROAS across all channels. You cannot improve what you cannot accurately measure.
Week 2: Audit your campaign structure. Migrate to Advantage+ Shopping if you have not already. Consolidate campaigns (fewer campaigns with more budget each performs better than many fragmented campaigns). Set existing customer caps at 10% to 20%.
Week 3: Launch a creative sprint. Produce 10 to 15 new creatives: a mix of UGC videos (30 to 60 seconds), static carousel ads, and catalog-based dynamic creatives. Test different hooks, different CTAs, and different formats. The algorithm needs variety.
Week 4: Optimize your landing pages. Run your product pages through Google PageSpeed Insights (target 70+ mobile score). Add trust signals (reviews, certifications, press mentions). Ensure UPI and COD checkout is seamless. Even a 0.5% improvement in conversion rate can move your ROAS by 0.3x to 0.5x.
This four-week sprint has moved brands from sub-2x to 2.5x+ ROAS in every category we have applied it to.
A “good” ROAS depends entirely on your category and margins. For beauty brands, 3x+ blended ROAS is strong. For fashion, 2.5x to 3.5x is the target. For F&B, anything above 2x is outperforming the category. The more important number is whether your ROAS exceeds your break-even ROAS, which you calculate based on your gross margin and fixed costs.
Three likely causes: CPM inflation (average CPMs rose 22% YoY for Indian D2C brands), creative fatigue (if you are not refreshing creatives weekly, performance degrades fast), or audience saturation (you have shown ads to your addressable market too many times). The fix is usually creative velocity first, campaign restructuring second.
Yes. Meta’s data and our own campaign data both confirm that ASC outperforms manual campaigns by 17% to 32% on cost per purchase. The caveat is that ASC needs at least 50 optimization events per week and 10+ active creatives to perform well. If your budget is below Rs 3L/month, you may not generate enough events.
For brands spending Rs 5L to 15L/month, we recommend 15 to 20 new creative variations per month. For brands spending Rs 15L+, that number should be 25 to 40. The key is variety in format (video, static, carousel, catalog) and variety in messaging angle (benefit-led, social proof, urgency, education). Top brands like boAt test 15 to 20 variations per product.
As of early 2026, the average CPM for Indian D2C brands on Meta is approximately Rs 850, up 22% from 2024-25. Health and wellness sees the highest CPMs (38% above average), while food and baby products see the most contained costs. CPMs spike during festive seasons (Diwali, Republic Day sales) and during major sale events on marketplaces.
Here is the uncomfortable truth: ROAS is a lagging indicator. By the time you see it drop, the underlying problems (creative fatigue, poor tracking, thin margins, slow pages) have been compounding for weeks.
The brands that consistently beat benchmarks are not obsessing over daily ROAS fluctuations. They are investing in the inputs: creative production systems, conversion rate optimization, data infrastructure, and full-funnel strategy.
If your Indian D2C brand is spending Rs 5L+ on Meta and your ROAS is not where it should be, we can tell you exactly what is wrong and how to fix it.
Get a free ROAS audit for your brand. We will analyze your campaign structure, creative performance, tracking setup, and landing pages, then give you a prioritized action plan. Book your 15-minute call here.